Creating a Custom vSphere Alarm will show all the necessary steps to create a custom vSphere Alarm to monitor the CPU usage of all virtual machines.
First Things First, What is an Alarm?
An alarm is a notification sent in response to an event or condition with an object in the inventory. When we install the vCenter Server, we have hundreds of alarms by default. However, custom alarms can be created to satisfy specific monitoring situations.
Selecting the vCenter server object, click on Configure –> Alarm Definitions. On this page, it is possible to see all predefined alarms, as we can see in the following picture:
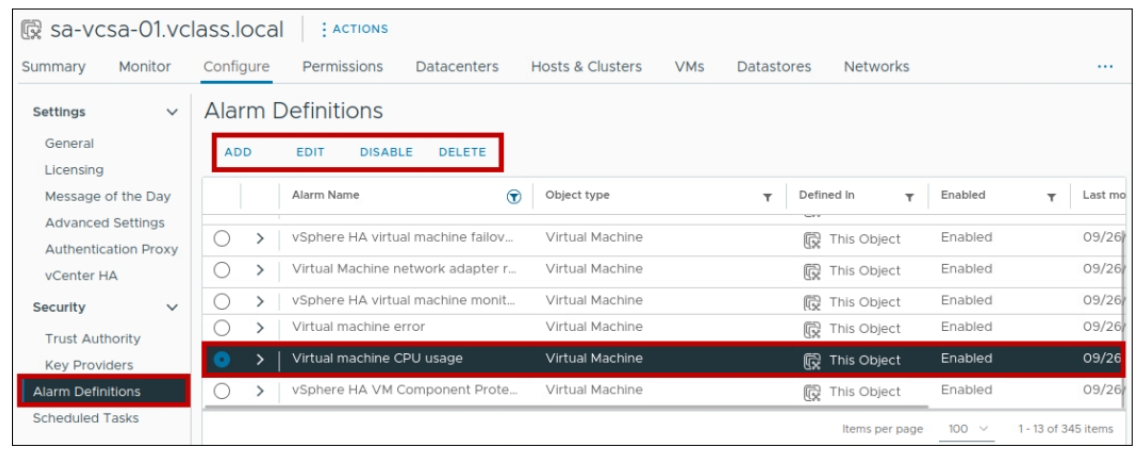
As we can see in the picture, it is possible to add new alarms, edit existing ones, disable them, and delete them.
Creating a Custom Alarm
In addition to using predefined alarms, we can create custom alarms on the vSphere Client to match specific monitoring situations.
For instance, we can create an alarm to show us when a virtual machine’s CPU usage is more than 80% for 2 minutes. If the condition matches, an alarm will appear on the vSphere Client (or an email will be sent, etc.).
In this example, we will create two custom alarms:
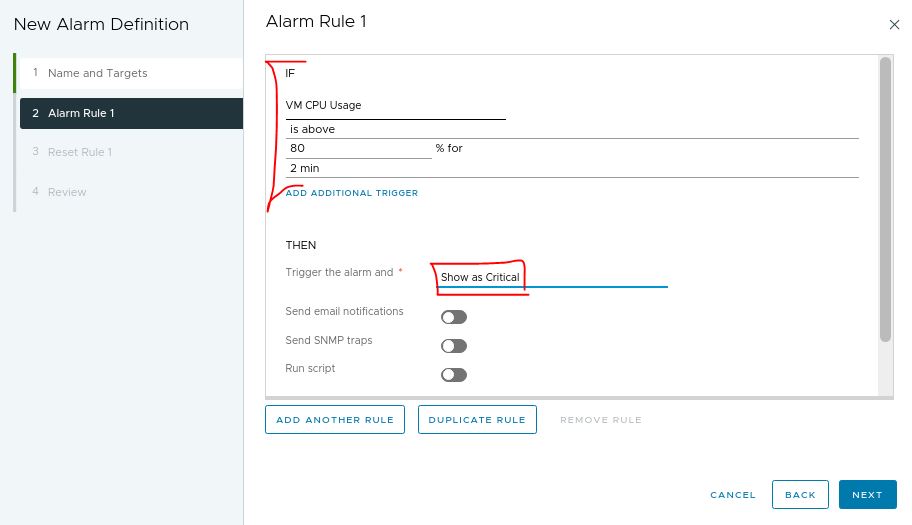
- If the VM CPU usage is higher than 80% for more than 2 minutes, trigger an alarm and show it as a Critical.
- If the VM CPU usage is higher than 60% for more than 2 minutes, trigger an alarm and show it as a Warning.
For both alarms, when the condition/states are no longer met, trigger an alarm and reset it to normal (green).
Alarm for VM CPU High Usage
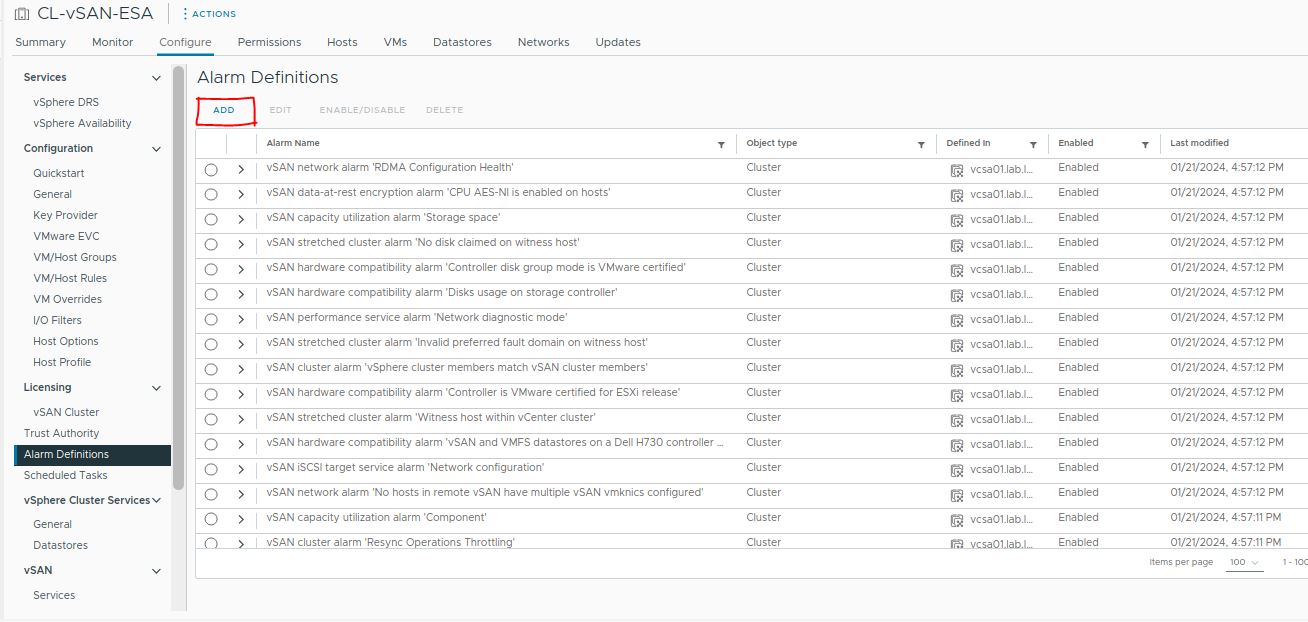
Open the vSphere Client interface, select the cluster object, and under Alarm Definitions click on ADD:
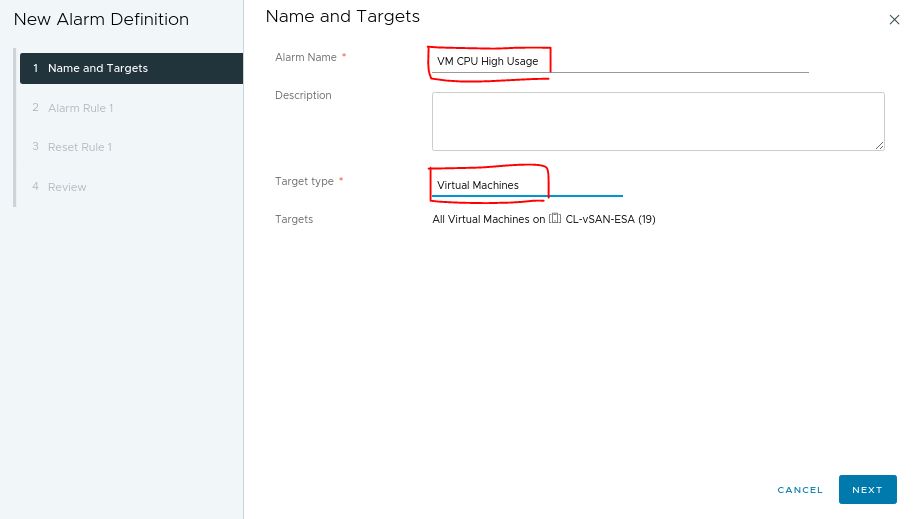
On the Alarm Name, type a name. Our example’s alarm is “VM CPU High Usage.”
On the Target type, we need to select the object level at which this alarm will be applied. Since this alarm is to monitor a VM CPU usage, we must choose “Virtual Machines”:
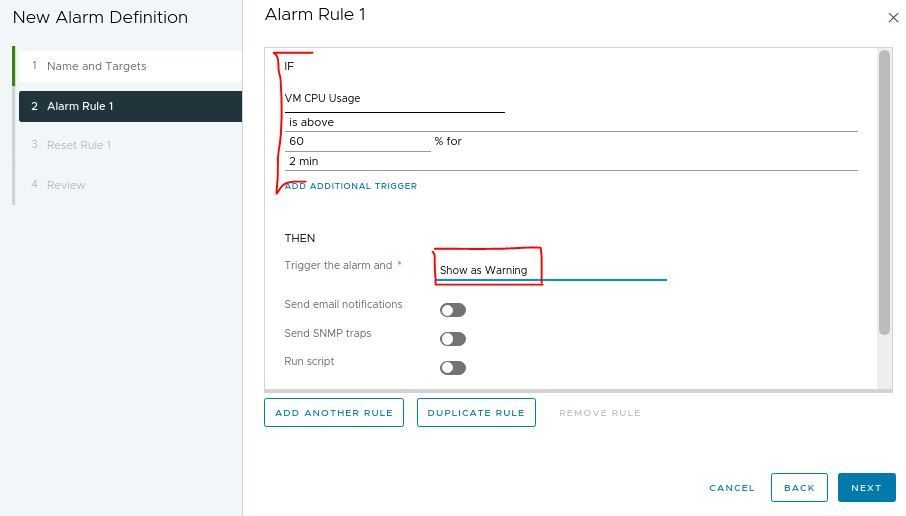
Under alarm rule 1, we will configure all conditions that will be monitored to trigger the alarm:
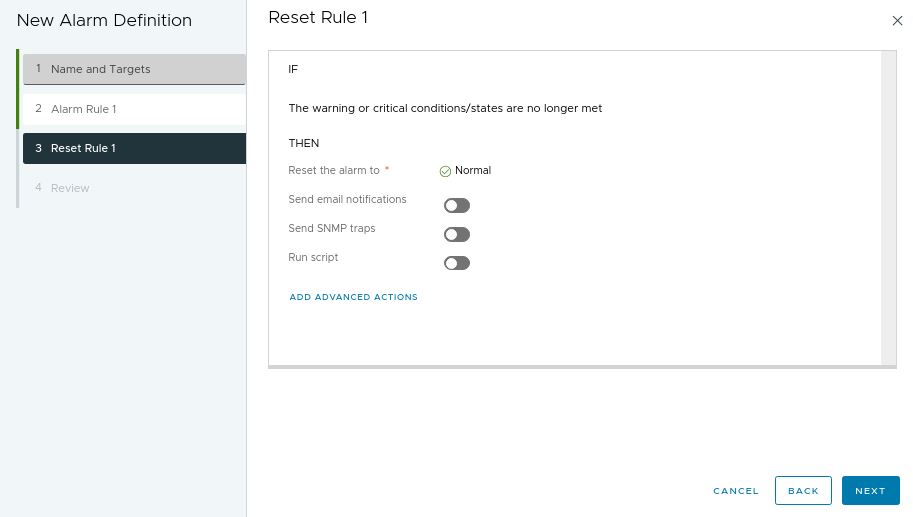
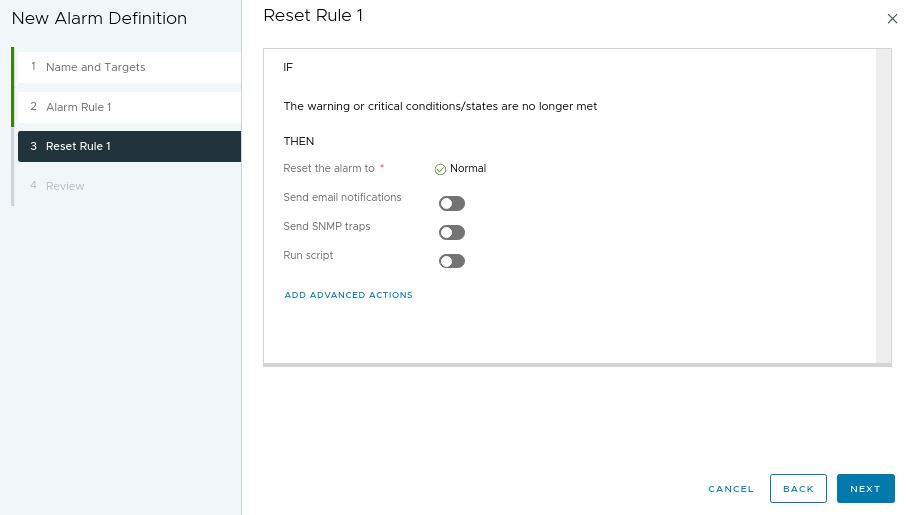
Under the reset rule, the default action is to reset the alarm to normal when this condition is no longer met. Look at what we have other possibilities, like sending an email, sending an SNMP trap, running a script, or choosing an advanced action:
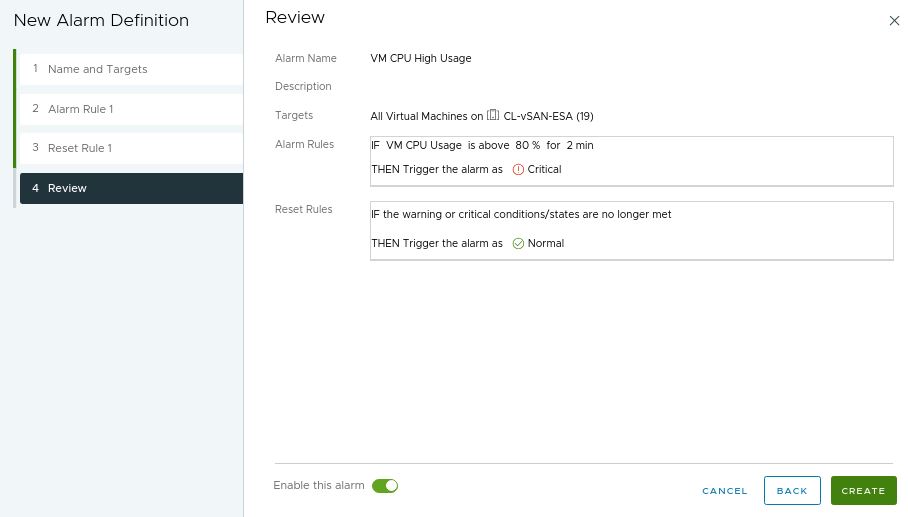
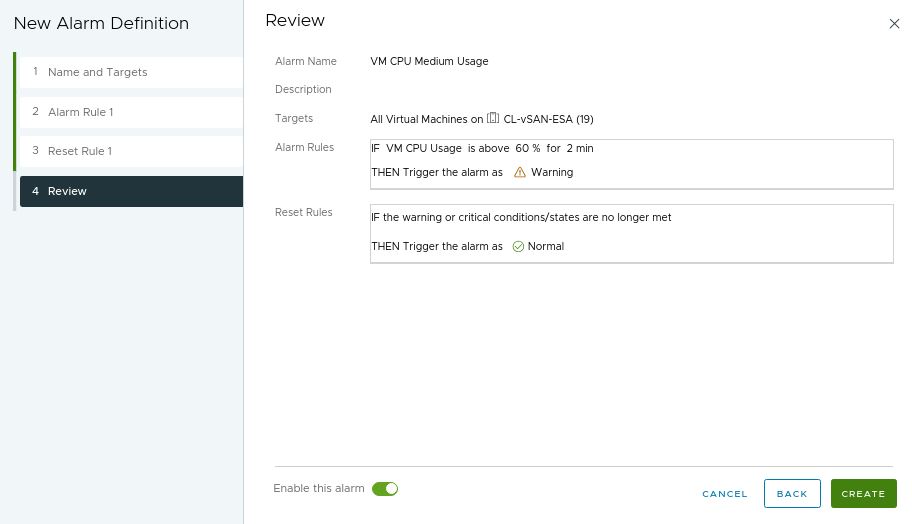
Under the review page, we can see a review of all the options we decided on. Click on CRATE to create the alarm:
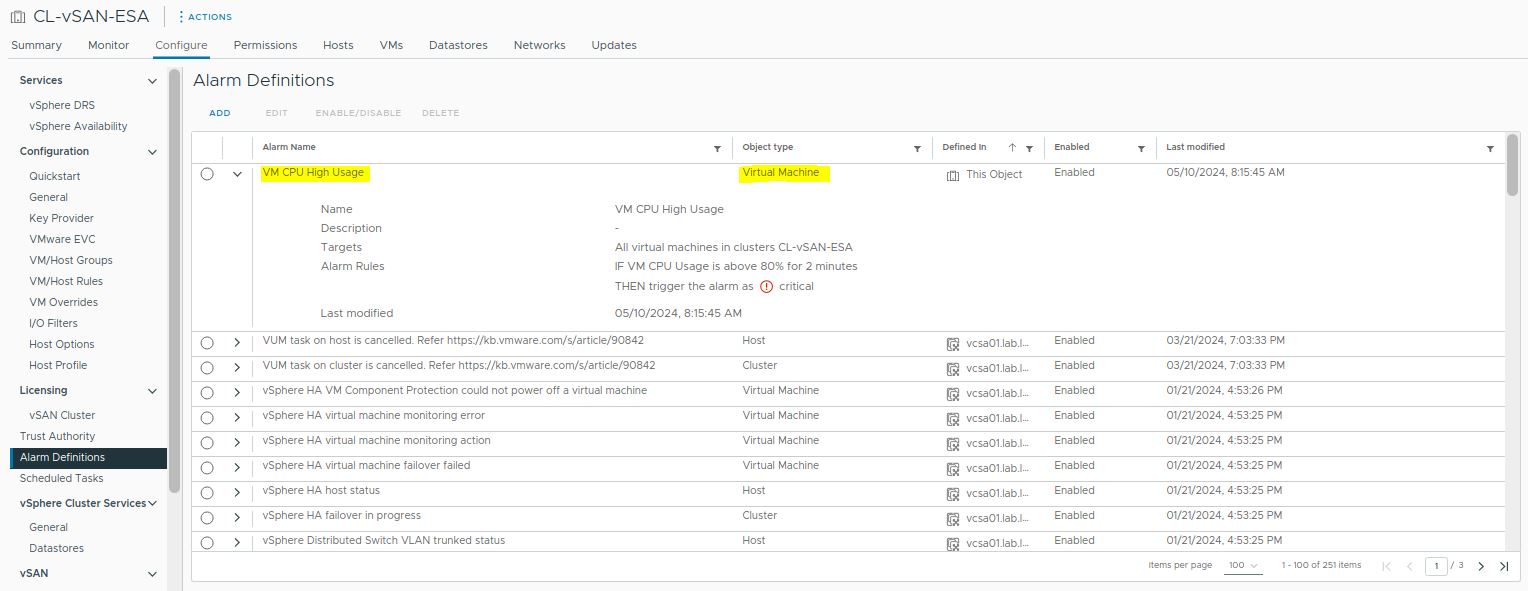
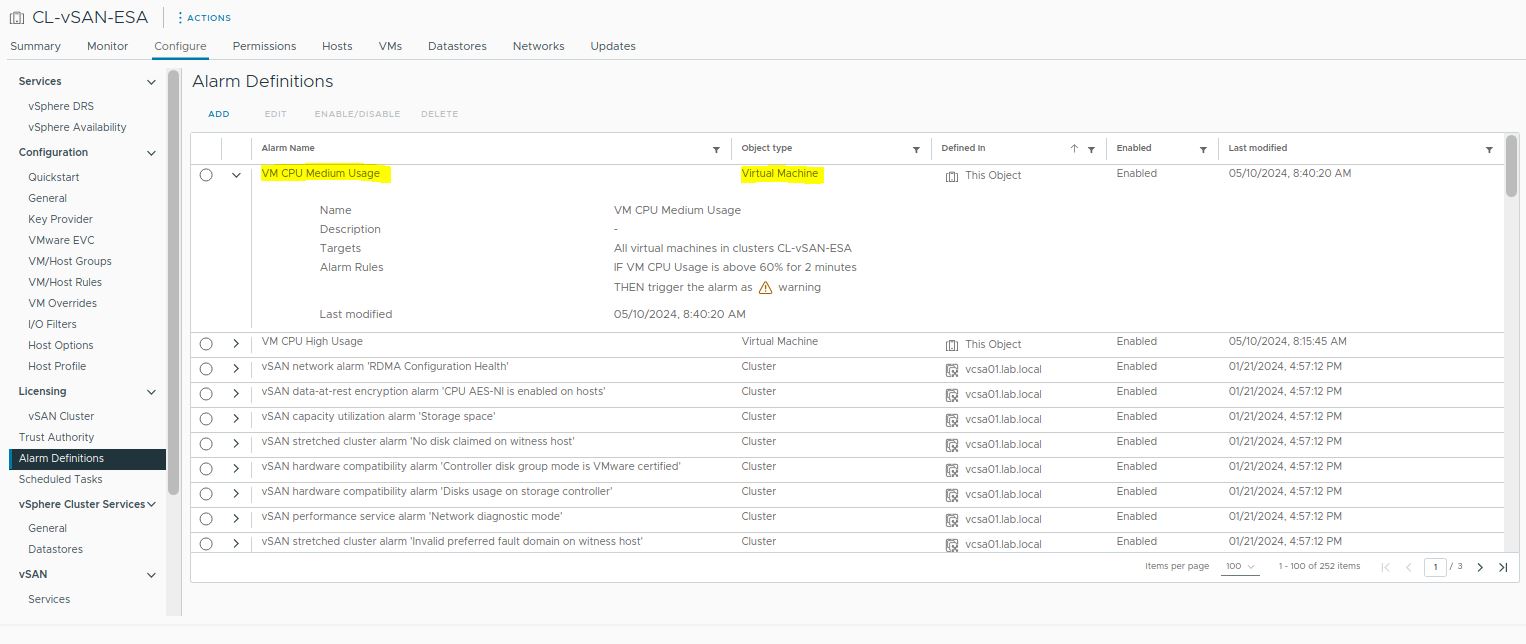
After creating the alarm, it is possible to see it under the alarm definitions list, as we can see in the following picture:
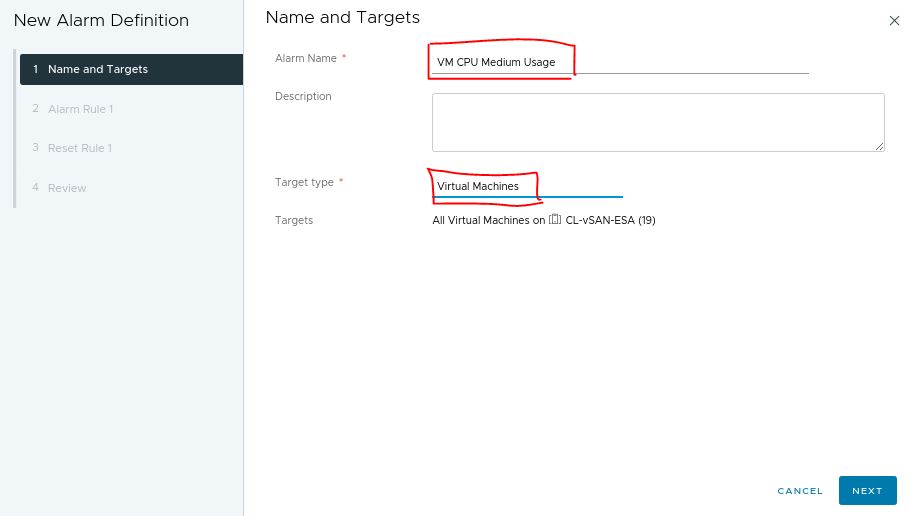
Now, we will create the next alarm to detect and trigger an alarm when the VM CPU usage is higher than 60% for more than 2 minutes:
Checking the Triggered Alarms
We can see all triggered alarms under the “Triggered Alarms” at the cluster level.
In the following pictures, we can see the triggered alarm:

Accessing the VM object in the vCenter inventory, we can also see the alarm name and its severity (Warning or Critical):

To Wrapping This Up
The alarm is an excellent way to monitor your cluster’s behavior and act proactively to avoid further negative impacts on your infrastructure or critical workloads.
I highly recommend you explore all alarms under the “Alarm Definition” section to become more familiar with them. Also, create your own alarms to understand how powerful this tool is.