Debugging vCenter and ESXi Heartbeat is an article that explains how to debug the ESXi heartbeat communication with the vCenter Server. We will use the tool “tcpdump” to help us in this troubleshooting.
The ESXi host (vpxa) sends UDP heartbeats packets to the vCenter Server (vpxd) every 10 seconds. This traffic uses UDP port 902.
The service on the ESXi host responsible to send these heartbeats packages is the vpxa. On the vCenter Server, the service responsible to handle the packets sent by vpxa is the vpxd.
The vCenter Server has a window of 60 seconds to receive the heartbeat packages. If the vCenter Server doesn’t receive a heartbeat from an ESXi host, vCenter treats the host as not responding.
Some symptoms about that, for example:
- ESXi hosts disconnect frequently from vCenter Server
- vCenter Server shows the ESXi host as not responding
- On the vpxd.log file, it is possible to see some events related to the missed heartbeats
Find the Management VMKernel
The ESXi host sends the UDP heartbeat package through the Management VMkernel.
So, the first thing here is to identify what VMKnerel ESXi is using for Management traffic.
Firstly, access the ESXi host by SSH and type the command below to see all VMKernels interfaces:
esxcli network ip interface ipv4 get
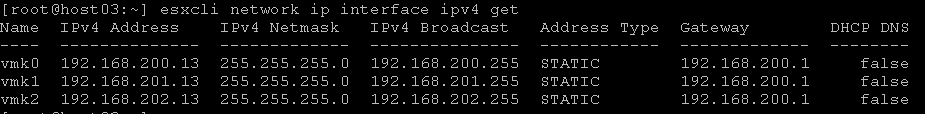
So, we have 3 VMkernels interfaces in this example. Now, we need to check what “Tag” is associated with each VMKernel interface. We can check it with the command below:
esxcli network ip interface tag get -i VMKERNEL
Where:
VMKERNEL = The VMKernel identifier, like vmk0, vmk1, etc
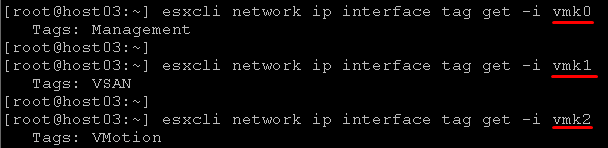
In our example, the Management interface is the vmk0.
The command below is a way to get all Tags automatically:
for i in $(esxcli network ip interface ipv4 get | sed 1,2d | awk -F" " '{print $1}'); do echo $i $(esxcli network ip interface tag get -i $i); done;
Analyzing the Heartbeat traffic on the ESXi host
Access the ESXi host by SSH and type the command below to see the UDP heartbeat packets from the ESXi host to the vCenter Server:
tcpdump-uw -i vmk0 port 902
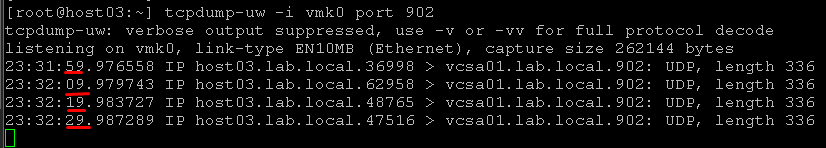
Observe that each packet was sent every 10 seconds!
Analyzing the Heartbeat traffic on the vCenter Server
Access the vCenter Server by SSH and type the command below to see the UDP heartbeat packets from the ESXi host to the vCenter Server:
tcpdump -i eth0 src 192.168.200.13 and port 902 -nn -v
Where:
src 192.168..200.13 = IP address of source ESXi host
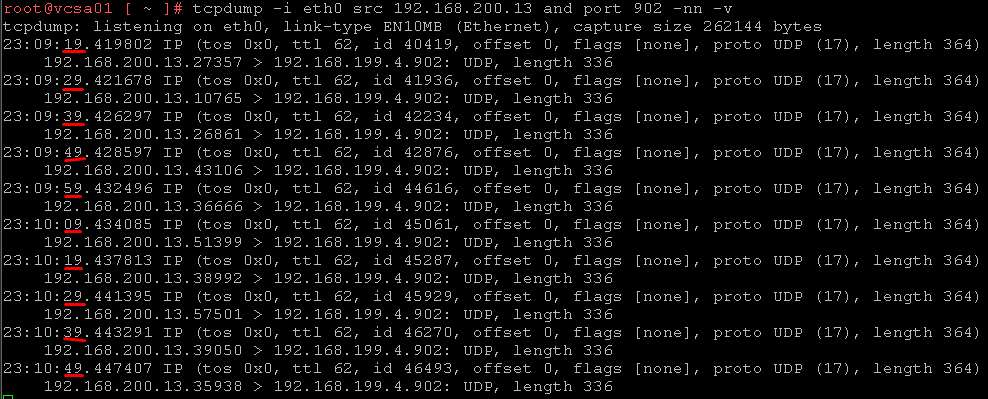
Observe that each packet was received every 10 seconds!
Note: If the heartbeat packet doesn’t receive by the vCenter Server, it can represent an issue with the network, firewall, or something like that. It is a good idea to review the network configurations to check if something may be disturbing this type of traffic.
If this behavior occurs with one ESXi host, for example, you can try to restart the vpxa service on this ESXi host and check if this action fixes the issue!
Additionally, I would like to share goods VMware’s KBs about this topic: