How to Deploy VMware Aria Operations for Logs is an article that explains how to deploy and configure VMware Aria Operations for Logs (formerly vRealize Log Insight).
Firstly, What is vRealize Log Insight?
vRealize Log Insight provides intelligent log management for infrastructure and applications in any environment. This highly scalable log management solution delivers intuitive, actionable dashboards, sophisticated analytics, and broad thirty-day extensibility across physical, virtual, and cloud environments.
Source: https://docs.vmware.com/en/vRealize-Log-Insight/index.html
Based on my Internet research, I would like to share my findings here:
- The last version of the vRealize Log Insight is 8.10.2:
https://docs.vmware.com/en/vRealize-Log-Insight/8.10.2/rn/vrealize-log-insight-8102-release-notes/index.html - The first version of the VMware Aria Operations for Logs is 8.12:
https://docs.vmware.com/en/VMware-Aria-Operations-for-Logs/8.12/rn/vmware-aria-operations-for-logs-812-release-notes/index.html
If you need to know more details about VMware Aria Operations for Logs, you can read the Product Datasheet in the below link:
https://www.vmware.com/content/dam/digitalmarketing/vmware/en/pdf/docs/vmw-datasheet-aria-operations-for-logs.pdf
Which are examples of VMware Aria Operations for Logs usage?
So, this tool is a powerful Syslog Server with a log of benefits such as:
- Rapid troubleshooting and root cause analysis within seconds;
- Intuitive and easy-to-use graphical interface for simple interactive searches as well as deep analytical queries;
- Extensible across physical, virtual, native, and public cloud environments, enabling admins to connect to everything in their environment (OS, Apps, Storage, Network Devices, etc.) and providing a single location to collect, store, and analyze logs at scale;
- Built-in knowledge and native support for VMware vSphere make VMware Aria Operations for Logs the best logging solution for VMware environments.
Download the Product
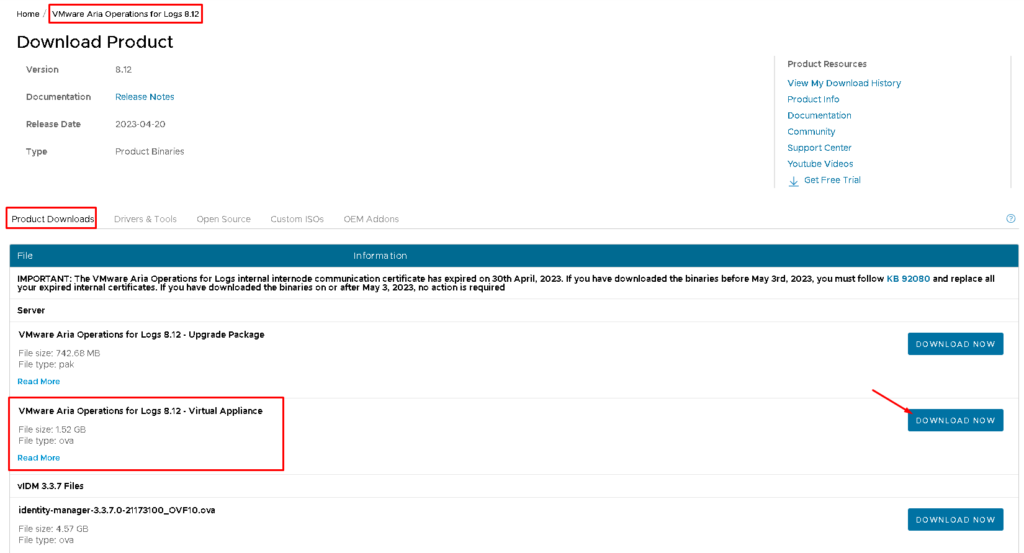
For downloading the VMware Aria Operations for Logs, access the below link:
https://customerconnect.vmware.com/en/downloads/info/slug/infrastructure_operations_management/vmware_aria_operations_for_logs/8_12
In this example, we are using the Virtual Appliance (OVA) file:
Deploying the Virtual Appliance
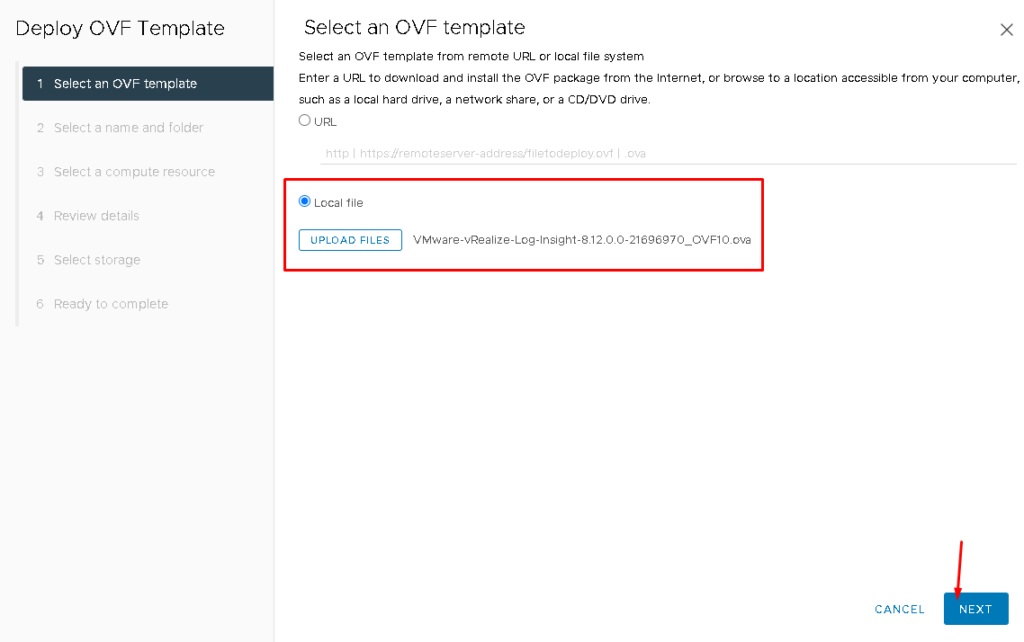
Here, we are deploying the Virtual Appliance file under a vSphere environment. After accessing the vSphere Client, select the Cluster Object –> Right Click on it –> Deploy OVF Template –> Select the OVF file. After that click on NEXT to continue:
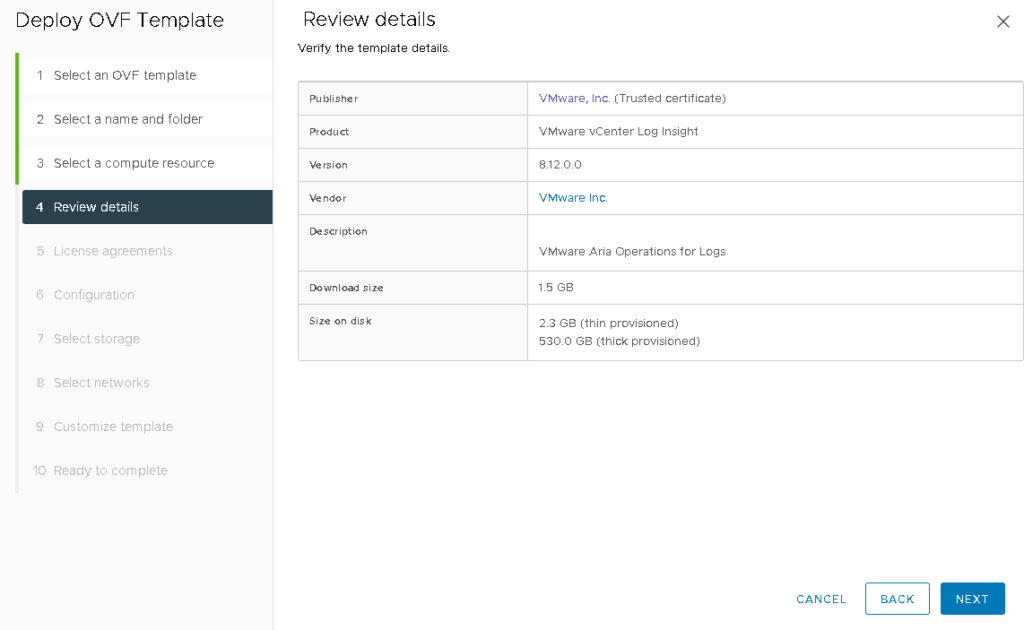
After selecting the name and folder, under review details click on NEXT to continue:
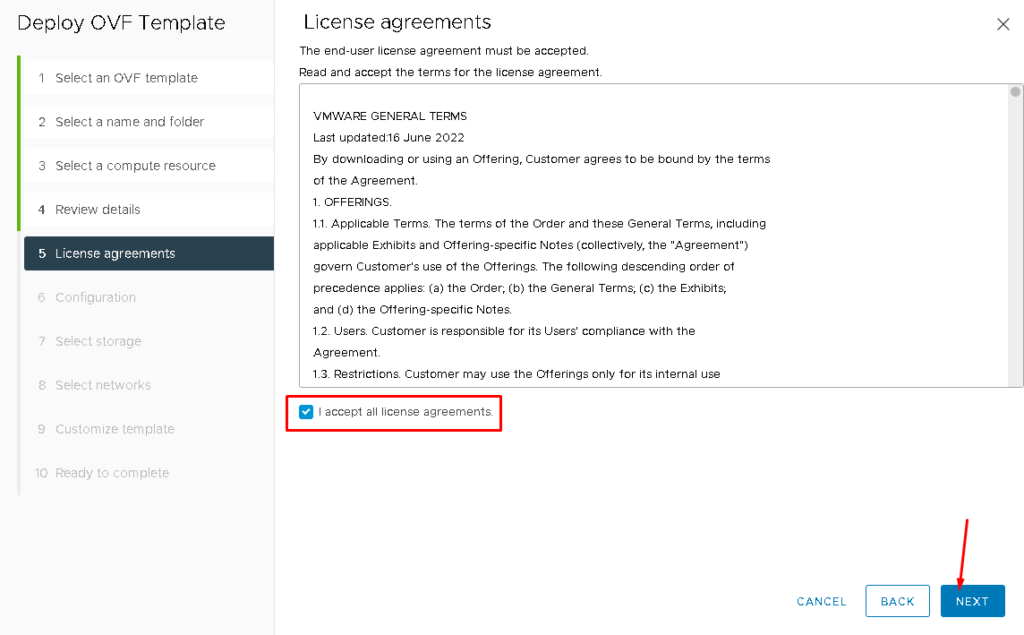
Mark the box ” I accept all license agreements” and click on NEXT:
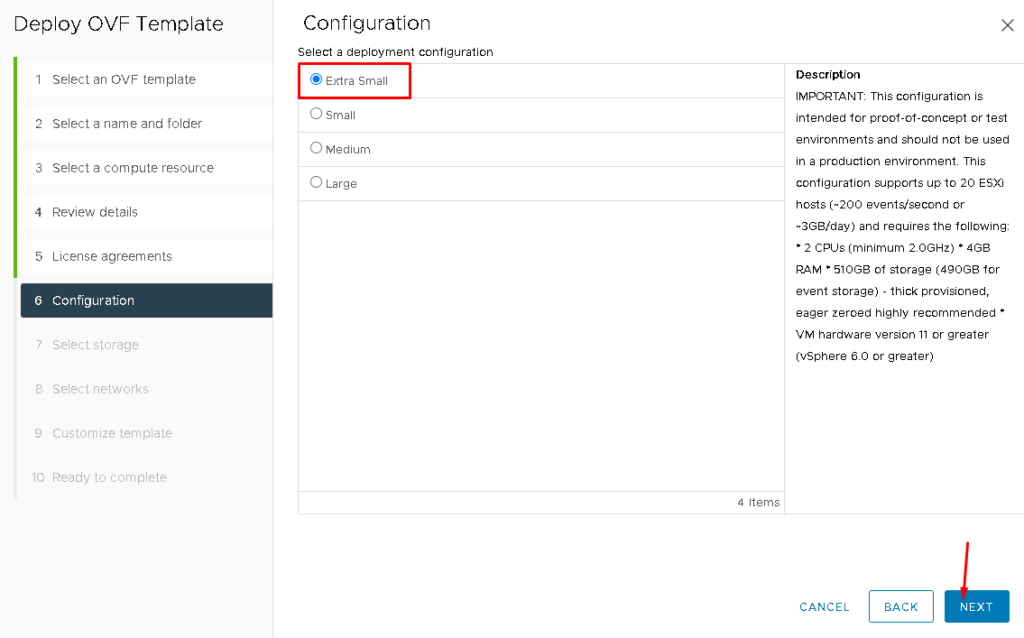
Here, we can choose the size of the deployment. We have four deployment sizes. In this case, we are choosing the “Extra Small” size.
Tip: After selecting the size, look at the right. We have a description of the selected size with a lot of important details such as CPU, memory, and disk configurations.
Click on NEXT to continue:
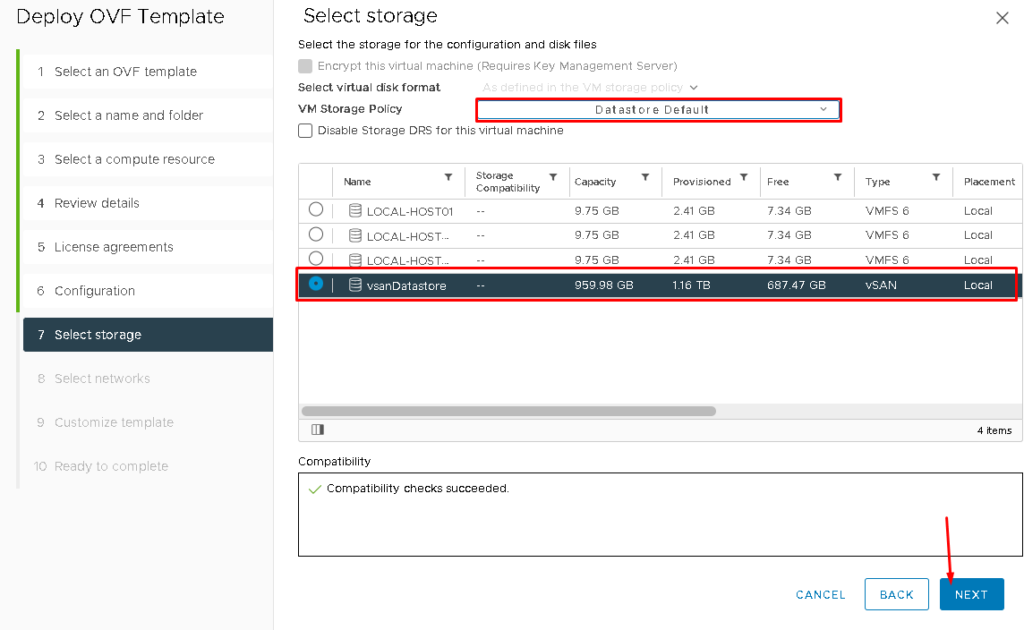
In our lab environment, we have a vSAN Cluster. So, we are selecting the vSAN Datastore as the Datastore to store the Virtual Appliance. But, you can select the better Datastore for your environment:
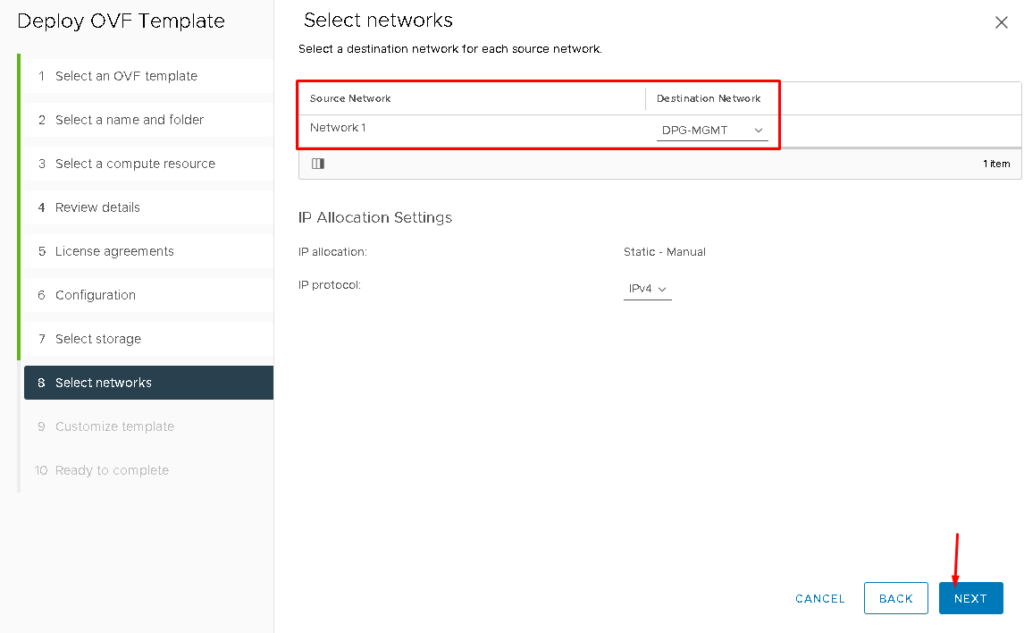
Select the network that will be used for the Virtual Appliance. In this example, our network port group is “DPG-MGMT“. Select the IP protocol (IPv4 or IPv6) and click on NEXT:
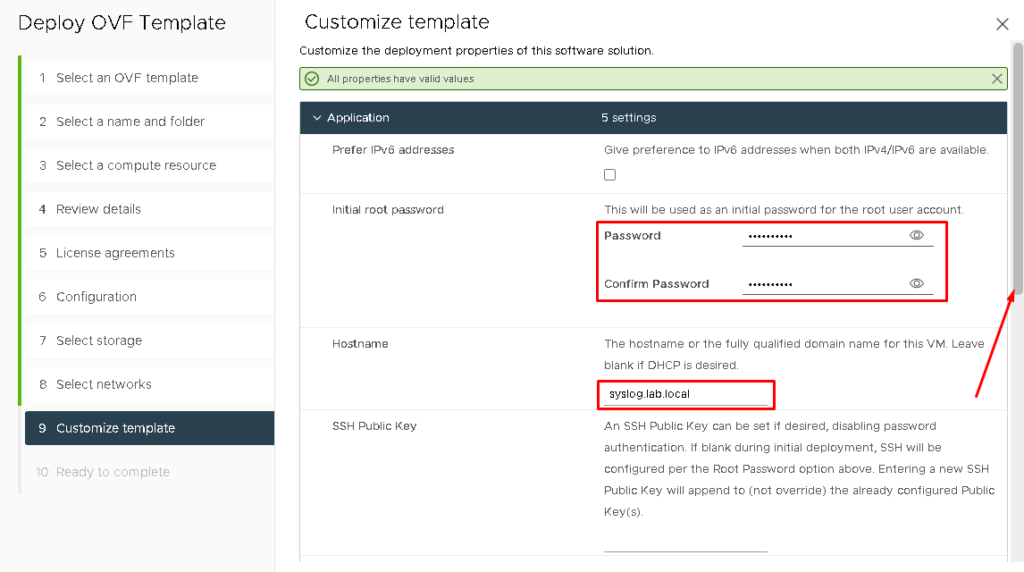
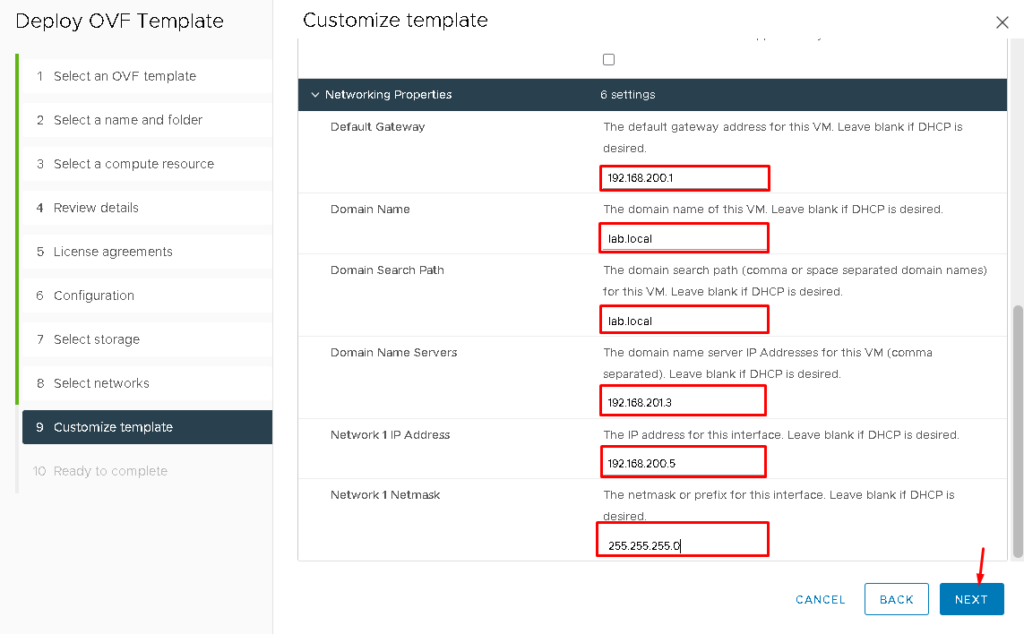
Under the Customize template, it is necessary to put your details such as root password, hostname, IP details, Domain Name, DNS server, etc. After typing these details, click on NEXT to continue:
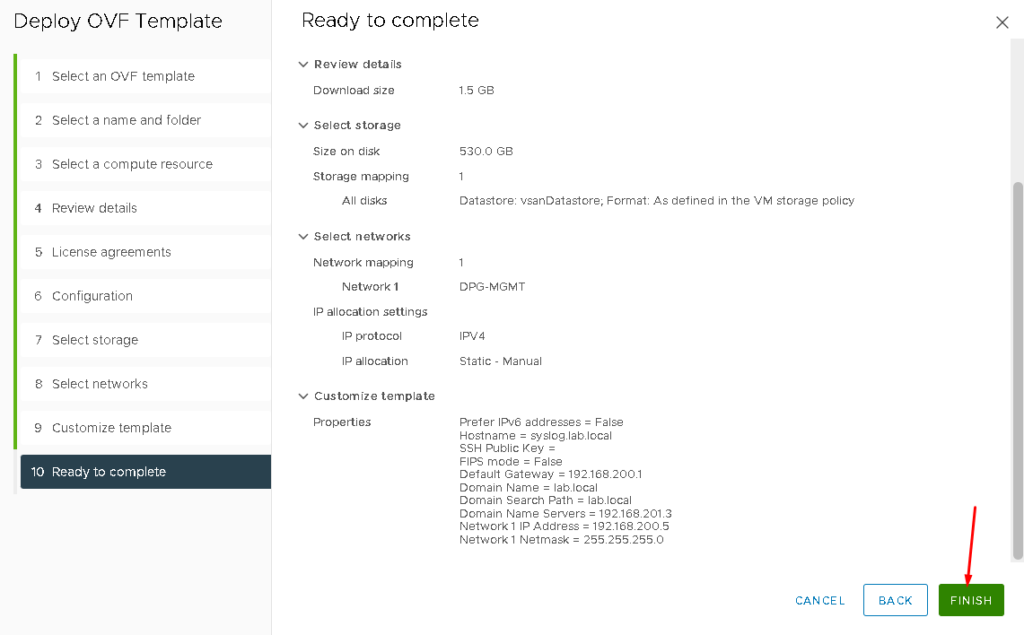
Under the Ready to Complete page, we can see all the configurations that we did. So, click on FINISH:
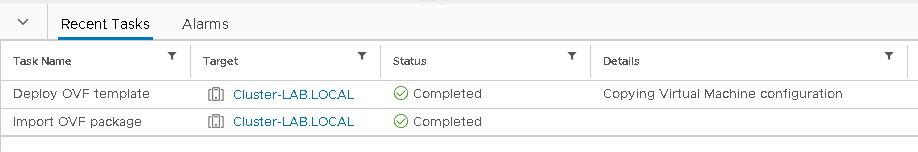
Under the vSphere Client Recent Tasks, we can monitor the deployment of the Virtual Appliance:
Setting Up VMware Aria Operations for Logs
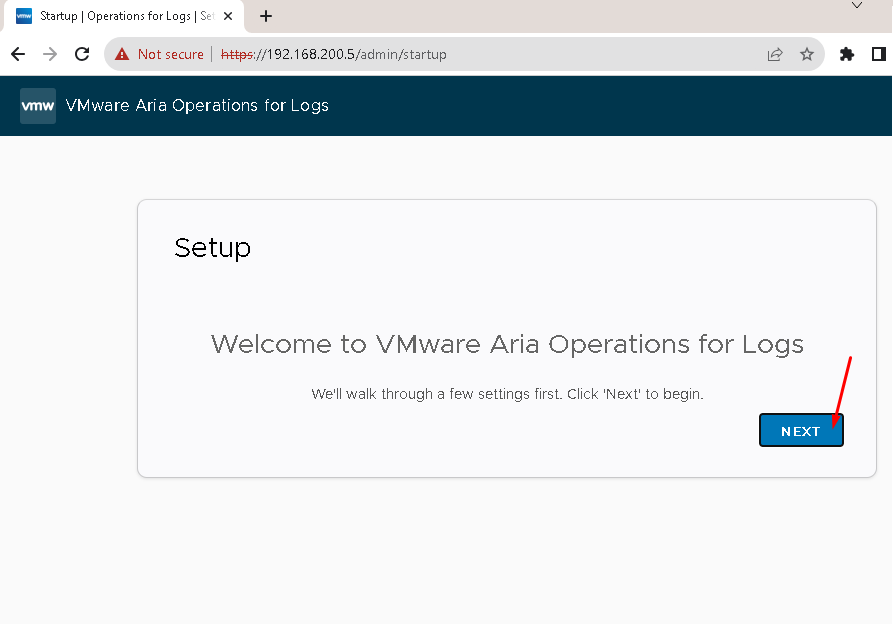
After the deployment step, we need to access the VMware Aria Operations for Logs through the GUI:
https://192.168.200.5
In this case, the IP address 192.168.200.5 is the IP address of our VMware Aria Operations for Logs appliance. Click on NEXT to continue:
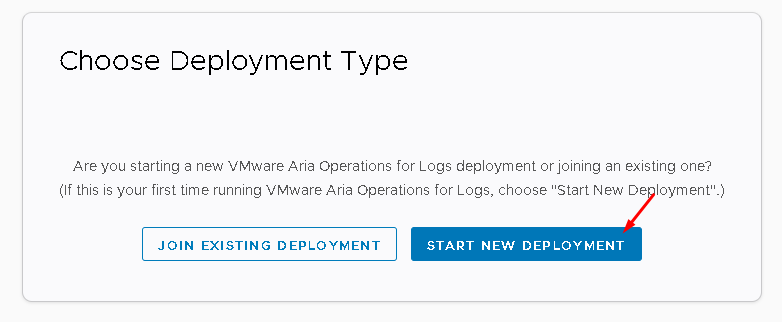
Click on “START NEW DEPLOYMENT” if it is your first deployment of the VMware Aria Operations for Logs:
Wait a few minutes while the deployment is running:

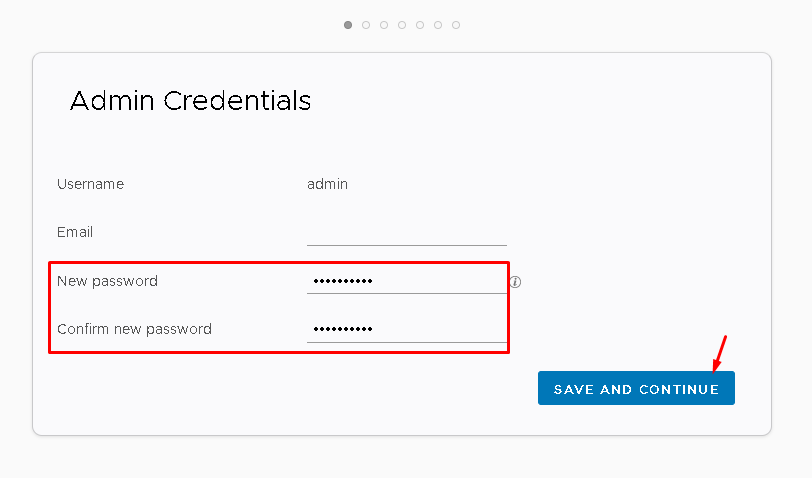
Now, we need to type the admin credentials for accessing the appliance through the Graphical User Interface. So, to access the appliance through the GUI, always we need to use the admin user. After that, click on SAVE AND CONTINUE:
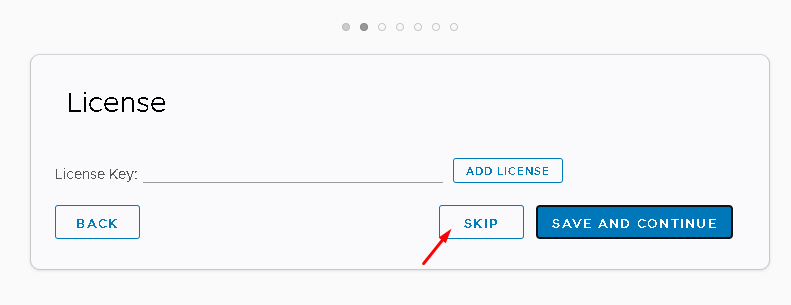
If you have a valid license, click on ADD LICENSE and type the license. In our case, we will type the license later. Click on SKIP:
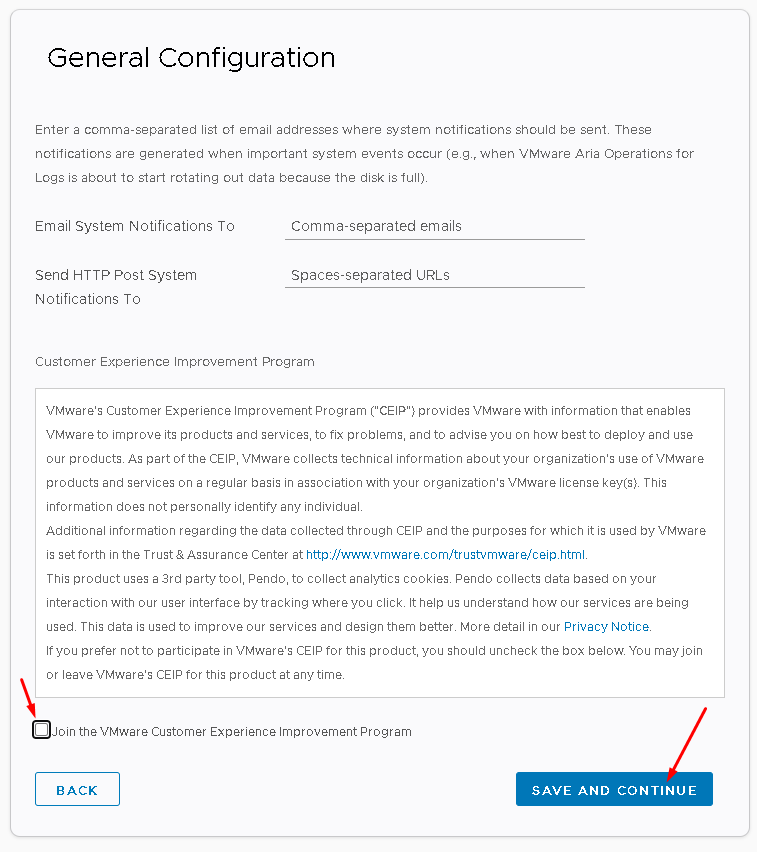
You can or cannot participate in the Customer Experience Improvement Program (CEIP).
After selecting your preference, click on SAVE AND CONTINUE:
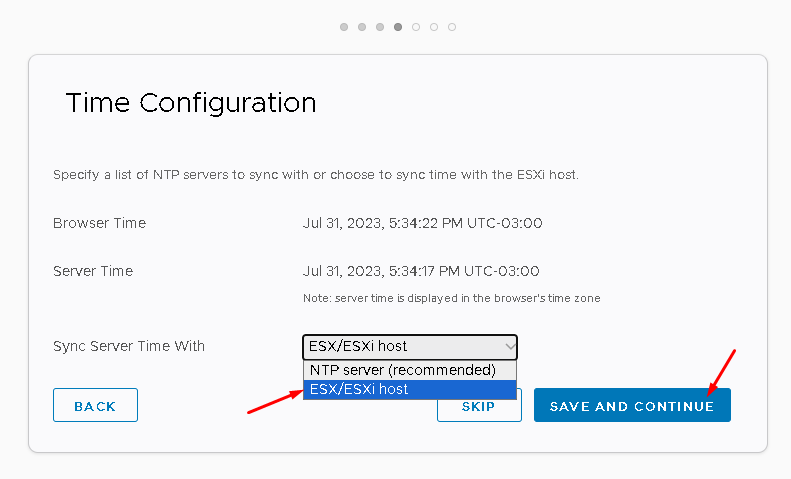
Here, we have an IMPORTANT configuration: Time Configuration.
We have two options here:
—- Sync the time with an ESXi host
—- Sync the time with a NTP Server
In this example, we are using an ESXi host. Click on SAVE AND CONTINUE:
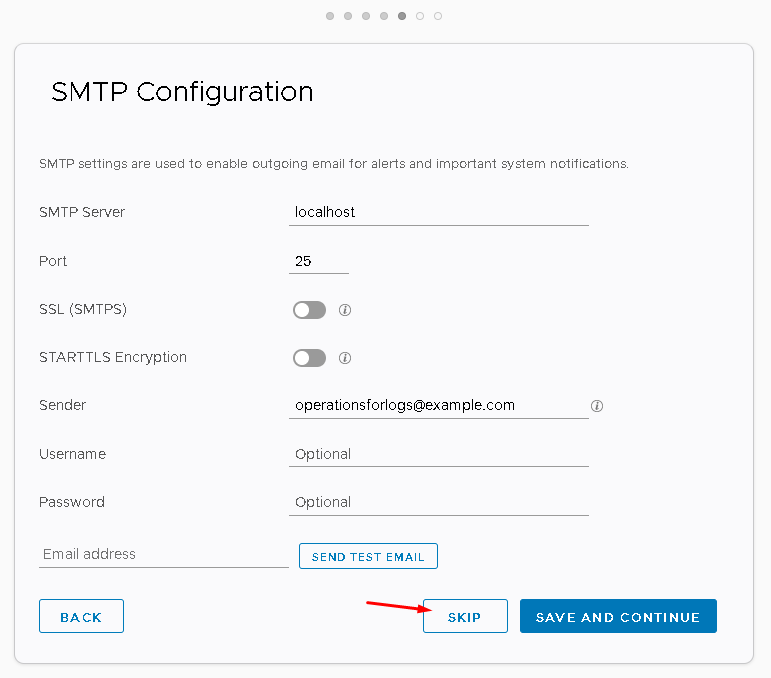
Provide your SMTP Configuration or click on SKIP to continue:
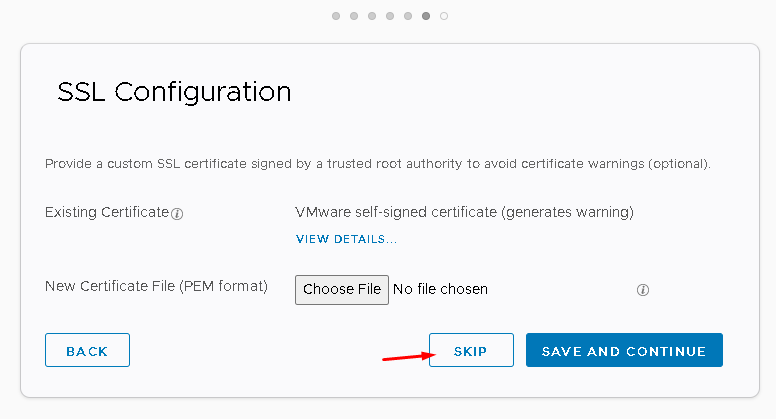
If you have a custom SSL certificate, you can upload it here or click on SKIP to continue:
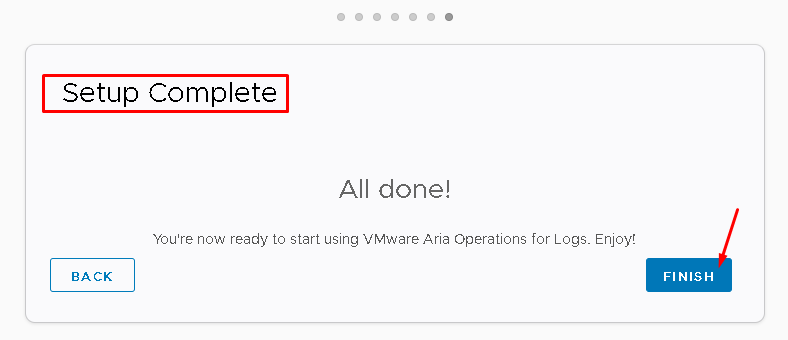
After that, your setup is complete. Click on FINISH:
Doing the First Access Through the GUI Interface
After finishing the setup, we can configure vSphere integration (if you have a vSphere Environment):
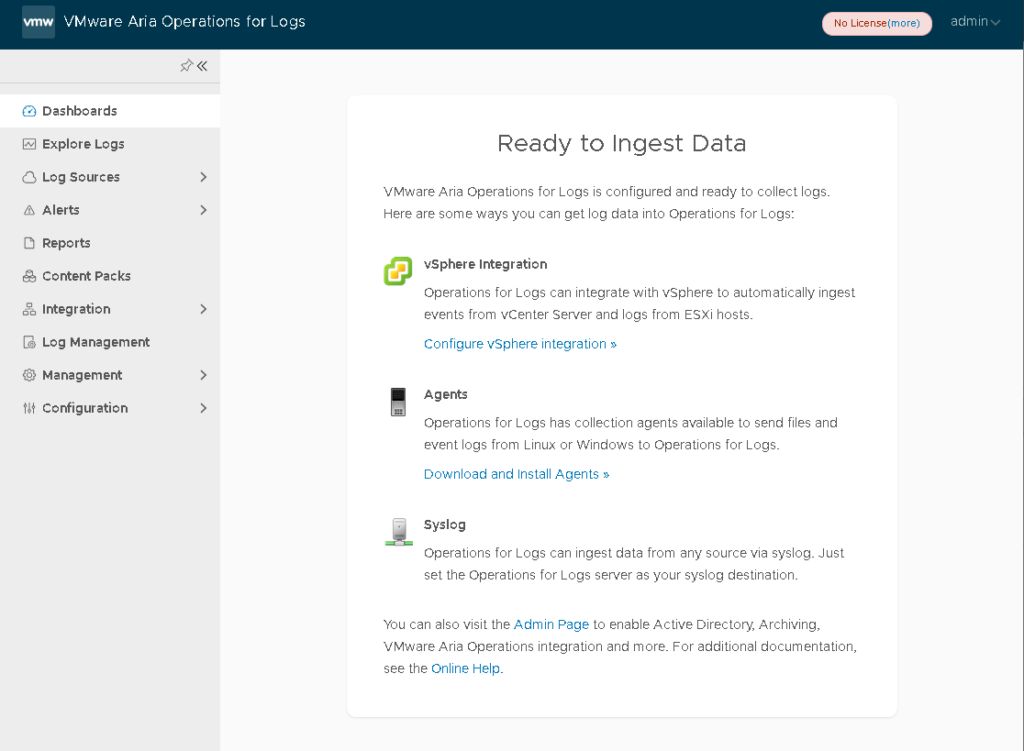
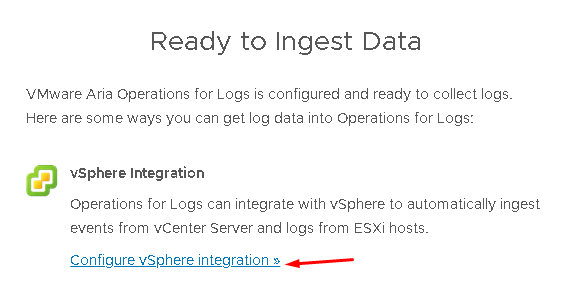
Under the Ready to Ingest Data, click on “Configure vSphere integration”:
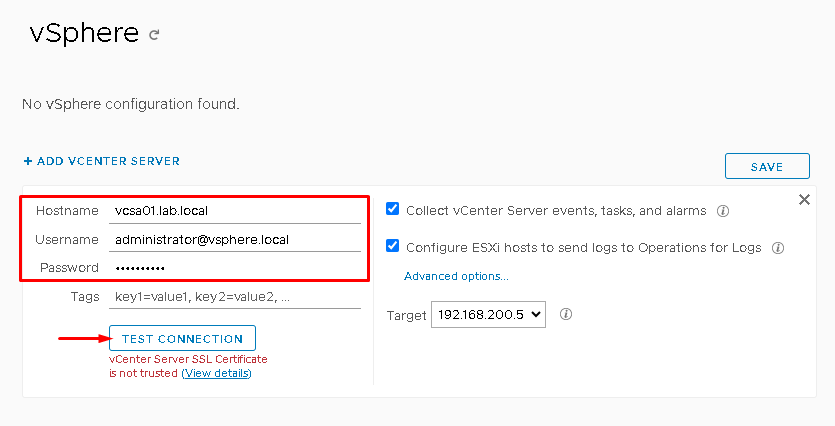
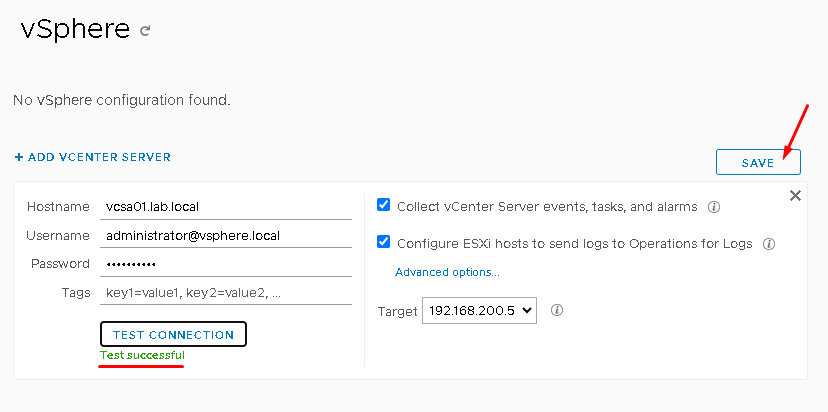
Type your vCenter Server details (Hostname, Username, and Password).
After that, click on “TEST CONNECTION”:
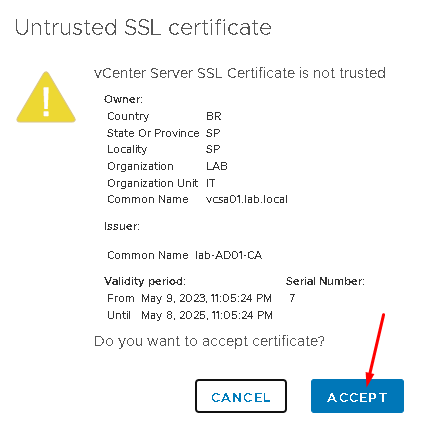
Accept the SSL certificate:
Click on SAVE:
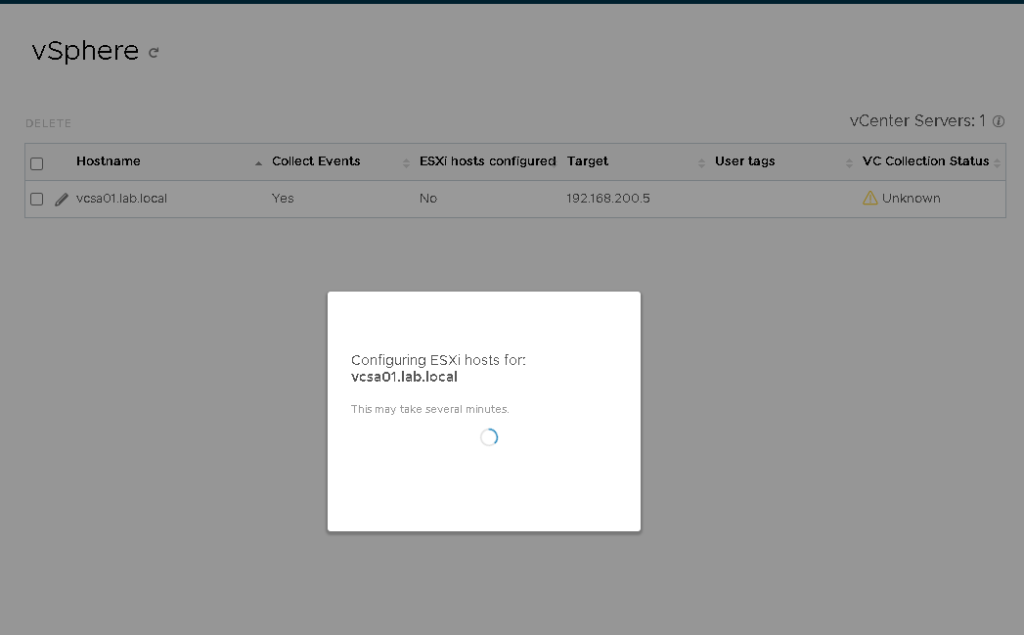
Here, we need to wait a few minutes while the configuration takes place:
When the configuration process is finished, we will receive a message indicating it. Click on OK:
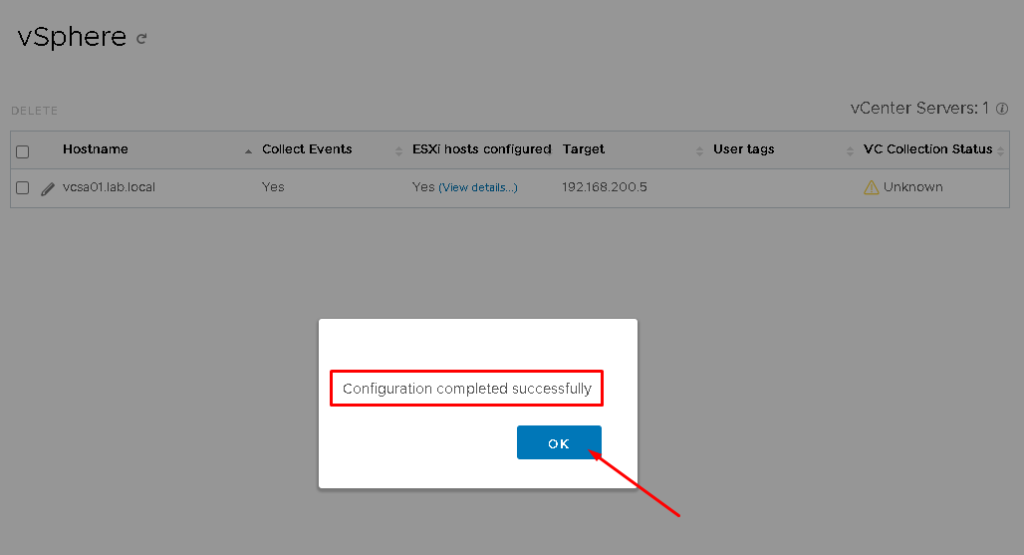
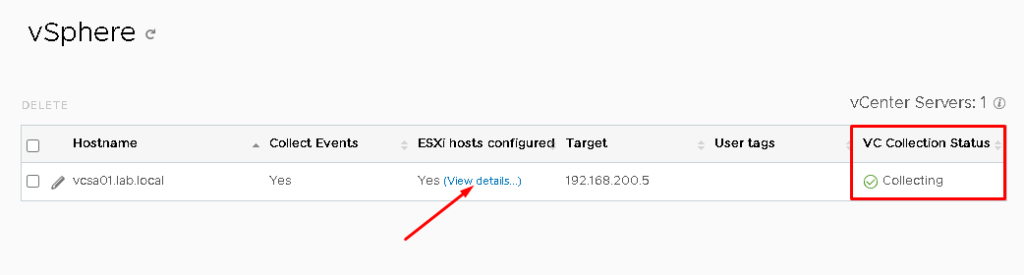
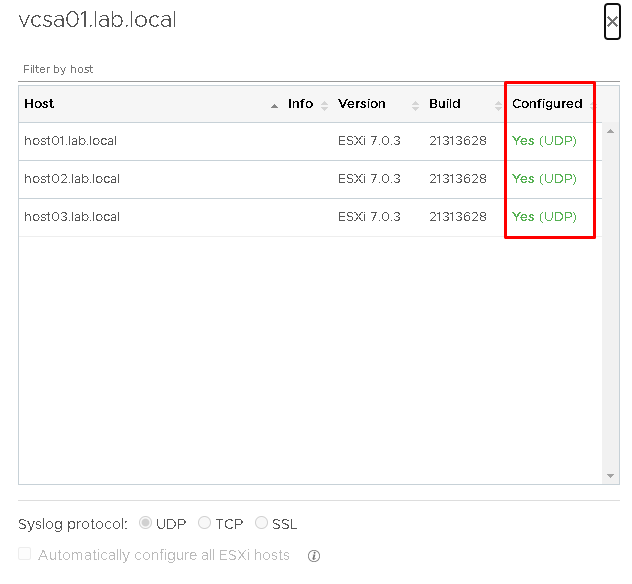
Under “ESXi hosts configured” we can see all ESXi hosts that were configured. Click on “View details”:
Also, if we can access the ESXi host by SSH, we can confirm that the host is configured to send logs to a Remote Host (Syslog Server):
esxcli system syslog config get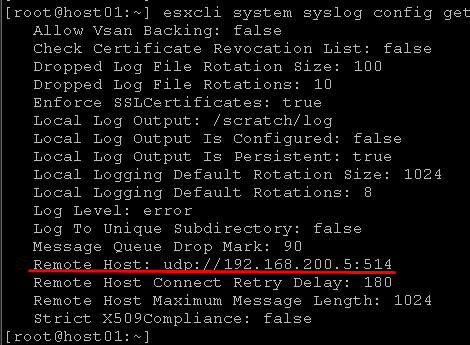
Explore Logs
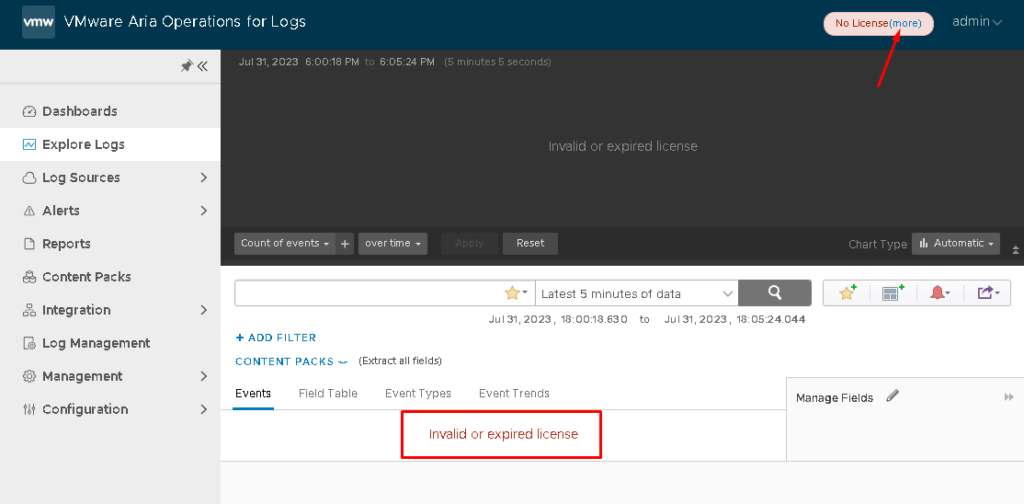
On the left, click on “Explore Logs” to see all Events sent by all ESXi hosts.
Look at the below picture. Because we do not have a license, we cannot see the events (we can see a message “Invalid or expired license”):
So, in this case, I got an evaluation license and applied for our Appliance.
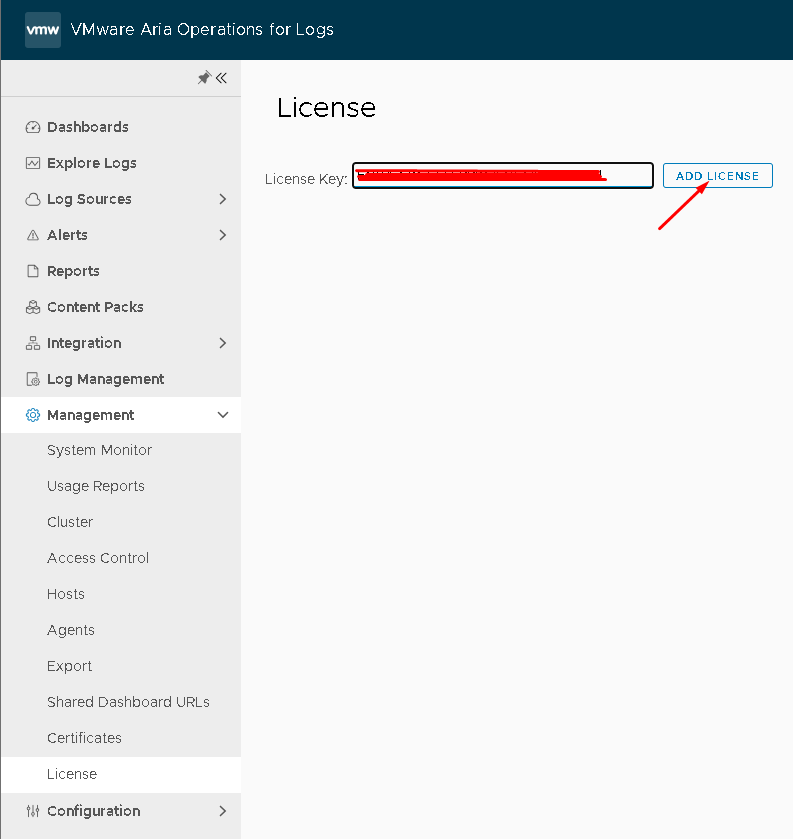
Under Management Menu –> Access the License –> Add License:
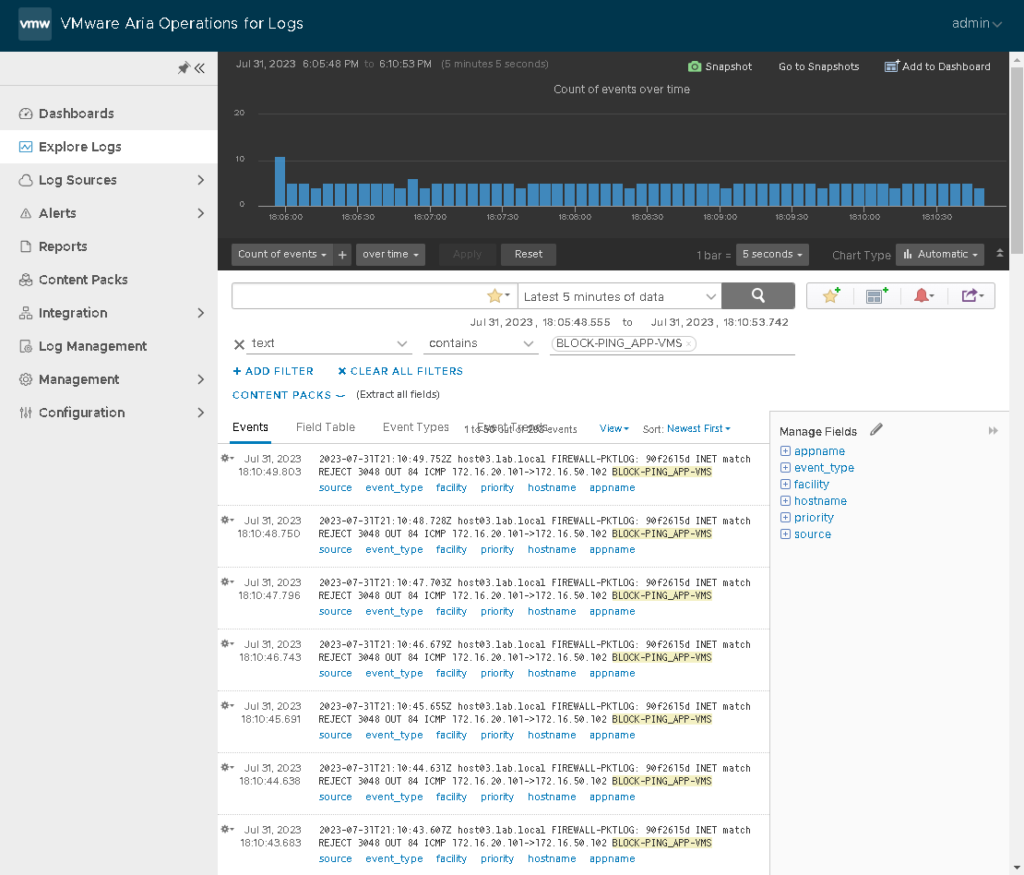
Now, we can see all events. It is possible to apply a lot of filters under all events. There is an excellent way to search events based on some text or some criteria:
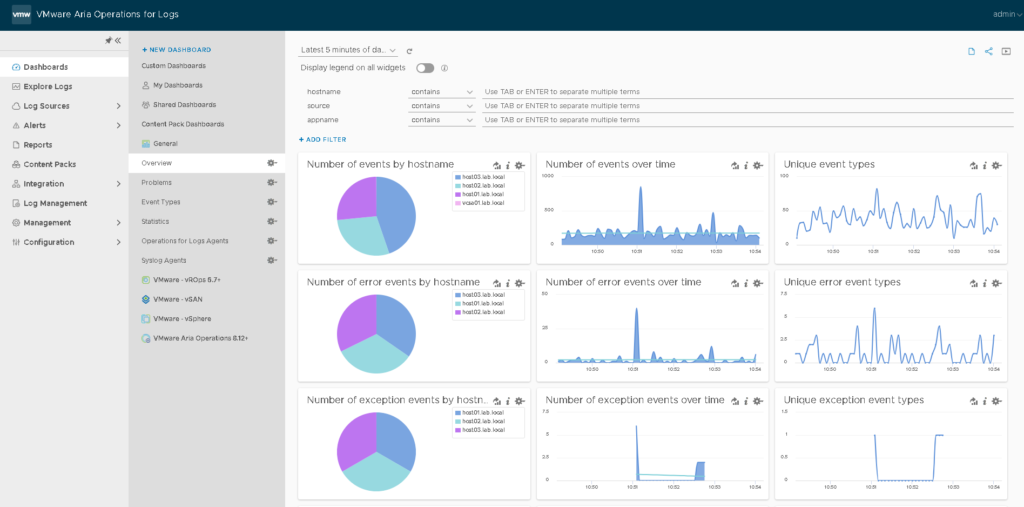
Under the menu Dashboards –> Overview, we can see a lot of interesting information and statistics 🙂 :