

Troubleshooting vCenter and ESXi heartbeat communication is an important step when an ESXi host intermittently appears as Not Responding, loses communication with vCenter Server, or experiences management failures while its virtual machines continue running normally.
In a healthy vSphere environment, the vpxa agent on each ESXi host participates in the management communication with vCenter Server and sends heartbeat traffic over UDP port 902. These heartbeats are monitored by the vpxd service on vCenter and provide a lightweight way to confirm that the host remains reachable through the management network.
By default, heartbeat traffic is sent approximately every 10 seconds. If vCenter does not receive the expected heartbeat within the default timeout window of approximately 60 seconds, the host can transition to the Not Responding state even though ESXi itself and the virtual machines running on it may still be operational.
A host in Not Responding state can automatically return to normal when communication is restored. This is different from the Disconnected state, in which the host has been explicitly disconnected from vCenter management.
Heartbeat failures are often caused by problems in the management network rather than by an ESXi host failure. Packet loss, firewall rules, routing problems, physical uplink issues, DNS problems, or an unhealthy management agent can all interrupt communication between ESXi and vCenter.
Common symptoms of ESXi heartbeat problems include:
- ESXi hosts intermittently transitioning between Connected and Not Responding.
- Management operations failing while virtual machines continue running normally.
- Delayed or failed host inventory updates in the vSphere Client.
- Heartbeat or communication timeout messages appearing in
vpxa.logorvpxd.log. - UDP 902 traffic being generated by ESXi but not reaching vCenter Server.
- Packet loss, firewall restrictions, routing problems, or uplink failures affecting the management network.
In this guide, I will show how to identify the Management VMkernel interface and trace UDP 902 heartbeat traffic at multiple points in the communication path: at the ESXi VMkernel interface, at the physical uplink, and finally at the vCenter Server Appliance. By comparing these capture points, we can determine whether the heartbeat is being generated, whether it is actually leaving the ESXi host, and whether it reaches vCenter Server.
Find the Management VMKernel
The ESXi host sends the UDP heartbeat package through the Management VMkernel.
So, the first thing here is to identify what VMKnerel ESXi is using for Management traffic.
Firstly, access the ESXi host by SSH and type the command below to see all VMKernels interfaces:
esxcli network ip interface ipv4 get
So, we have 3 VMkernels interfaces in this example. Now, we need to check what “Tag” is associated with each VMKernel interface. We can check it with the command below:
esxcli network ip interface tag get -i VMKERNELWhere:
- VMKERNEL = The VMKernel identifier, like vmk0, vmk1, etc
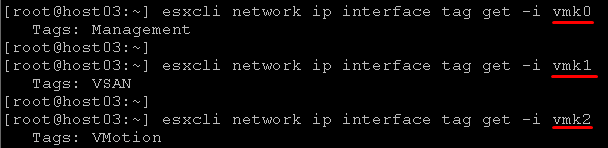
In our example, the Management interface is the vmk0.
The command below is a way to get all Tags automatically:
for i in $(esxcli network ip interface ipv4 get | sed 1,2d | awk -F" " '{print $1}'); do echo $i $(esxcli network ip interface tag get -i $i); done;

Analyzing the Heartbeat traffic on the ESXi host
Access the ESXi host by SSH and type the command below to see the UDP heartbeat packets from the ESXi host to the vCenter Server:
tcpdump-uw -i vmk0 port 902
Observe that each packet was sent every 10 seconds!
Confirm That the Heartbeat Leaves the Physical Uplink
Seeing the heartbeat on the Management VMkernel confirms that ESXi is generating the traffic. If the objective is to prove that the packet is actually leaving the host toward the physical network, capture it at the physical uplink as well.
First identify the uplink carrying the Management VMkernel traffic.
One practical method is:
esxtopPress:
nto open the network view and identify the physical uplink associated with the Management VMkernel.
Then capture outgoing UDP 902 traffic:
pktcap-uw \
  --uplink vmnic0 \
  --capture UplinkSndKernel \
  --udpport 902 \
  -o - | tcpdump-uw -enr -
Replace vmnic0 with the uplink used in your environment.
In a healthy environment, you should normally see a heartbeat approximately every 10 seconds.
Analyzing the Heartbeat traffic on the vCenter Server
Access the vCenter Server by SSH and type the command below to see the UDP heartbeat packets from the ESXi host to the vCenter Server:
tcpdump -i eth0 \
  src host 192.168.200.13 \
  and udp port 902 \
  -nn
Where:
- src 192.168..200.13 = IP address of source ESXi host
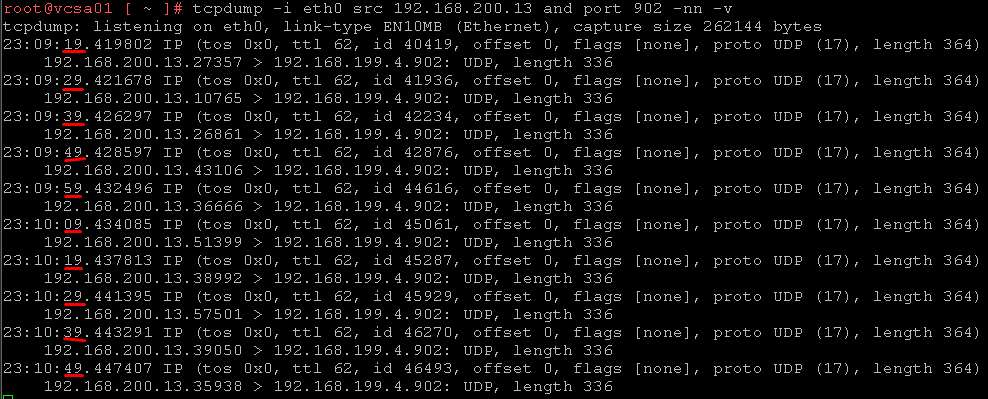
Observe that each packet was received every 10 seconds!
If the same heartbeat packets observed leaving the ESXi uplink are visible on the VCSA, the network path is successfully delivering UDP 902 to vCenter.
If the heartbeat leaves ESXi but does not appear on the VCSA capture, the failure domain is somewhere between the ESXi uplink and the vCenter network stack – for example, a physical switch, firewall, routing path, security policy, congestion, or packet loss.
Note: Do not expect vCenter Server to send a UDP reply for every heartbeat packet. The objective of this capture is to confirm that the heartbeat generated by ESXi reaches the vCenter Server.
Interpret the Capture Results
Heartbeat Is Not Visible on the ESXi Host
If no UDP 902 heartbeat is being generated, investigate the ESXi management agents and their configuration.
Check:
/etc/init.d/vpxa statusReview:
tail -f /var/run/log/vpxa.logYou can also inspect the vCenter communication information stored for the vpxa solution user:
configstorecli config current get \
  -c esx \
  -g services \
  -k vpxa_solution_user_config
Look for values such as the vCenter address and:
server_port: 902A wrong server_port can cause the host to send heartbeats to an incorrect UDP port; Broadcom has documented environments where vCenter propagated an incorrect value to the hosts.
Heartbeat Leaves ESXi but Does Not Reach vCenter
This points strongly toward the network path between the ESXi host and vCenter.
Investigate:
- firewall rules;
- physical switching;
- management VLAN;
- routing;
- packet loss;
- congestion;
- security appliances;
- intermittent uplink problems.
Broadcom documents this exact scenario: heartbeats can be seen leaving ESXi but disappear before arriving at the VCSA.
If packet loss needs to be investigated deeper through the ESXi datapath, see “How to Troubleshoot Packet Drops on an ESXi Host“.
Heartbeat Reaches vCenter but the Host Still Flaps
Then the network path alone does not explain the problem.
Investigate:
vpxa.log;hostd.log;vpxd.log;- DNS resolution;
- management-agent health;
- resource contention;
- vCenter health.
If the heartbeat path is healthy but the environment still requires additional tolerance for temporary management-network interruptions, see “vCenter ESXi Heartbeat Timeout: Troubleshooting and Temporary Workaround“. Increasing the timeout should only be considered after the underlying cause has been investigated.
What the Heartbeat Capture Tells You
The vCenter-to-ESXi management relationship becomes much easier to troubleshoot when the heartbeat path is observed at more than one point.
Capturing UDP 902 at the ESXi Management VMkernel confirms that the host is generating heartbeat traffic. Capturing it again at the physical uplink confirms that the packet is leaving the ESXi host. Finally, capturing the same traffic on the VCSA establishes whether the network successfully delivered it to vCenter.
This creates a clear troubleshooting boundary: if the heartbeat leaves ESXi but never reaches vCenter, investigate the network path. If the heartbeat is not generated by ESXi, investigate the management agents and their configuration. If it reaches vCenter but the host still transitions to Not Responding, continue with the vCenter and ESXi management logs rather than assuming that UDP 902 is being blocked.
External References
- Verify ESXi Host Heartbeat to vCenter Using Packet Capture Utilities Broadcom procedure for capturing UDP 902 heartbeat traffic leaving an ESXi physical uplink and confirming that the same packets arrive at the vCenter Server Appliance.
- ESXi Host Disconnects from vCenter Server Intermittently Broadcom explanation of the ESXi heartbeat interval, the default 60-second vCenter timeout, and network or firewall conditions that can cause missed UDP 902 heartbeats.
- Understanding Not Responding and Disconnected ESXi Hosts Official explanation of the difference between a host that becomes Not Responding because vCenter stops receiving heartbeats and a host placed in the Disconnected state.
- ESXi Host Intermittently Transitions to Not Responding Due to UDP 902 Packet Loss Broadcom troubleshooting example where ESXi generates heartbeats correctly but the physical network drops packets before they reach vCenter Server.
- ESXi Hosts Entering Not Responding Due to Incorrect UDP Port Configuration Broadcom case showing how an incorrect vpxa heartbeat server-port configuration can prevent heartbeats from reaching vCenter even when the underlying network is operational.
-
Restarting Management Agents in ESXi
Broadcom guidance for safely restarting the
hostdandvpxamanagement agents, including important considerations for vSAN, NSX, LACP, and other environments.
