

Linux process resource usage analysis is one of the first steps to take when a server becomes slow, unstable, or unresponsive. Instead of immediately restarting services or adding hardware, administrators should identify which resource is under pressure and which process is responsible for it.
A high load average does not always mean that the CPUs are overloaded, just as low free memory does not automatically indicate a memory problem. Linux uses available memory for cache and may report high system load when processes are waiting for disk operations rather than CPU time.
In this small guide, we will investigate CPU, memory, disk, and network activity using basic Linux commands. The goal is to understand the most important metrics, identify resource-intensive processes, and decide which corrective actions to take.
Start with a General System Overview
Before investigating individual processes, confirm whether the problem is affecting the entire system or only a specific application. The uptime command provides a useful first view:
uptimeIts output displays the current time, system uptime, logged-in users, and the load average for the last 1, 5, and 15 minutes.
Example:
10:42:15 up 23 days, 4:17, 3 users, load average: 6.20, 5.81, 4.10Load average represents the number of tasks that are running or waiting for CPU time or uninterruptible I/O operations. To interpret it correctly, compare the values with the number of logical CPUs available in the system:
nproc
You can obtain additional processor details with:
lscpu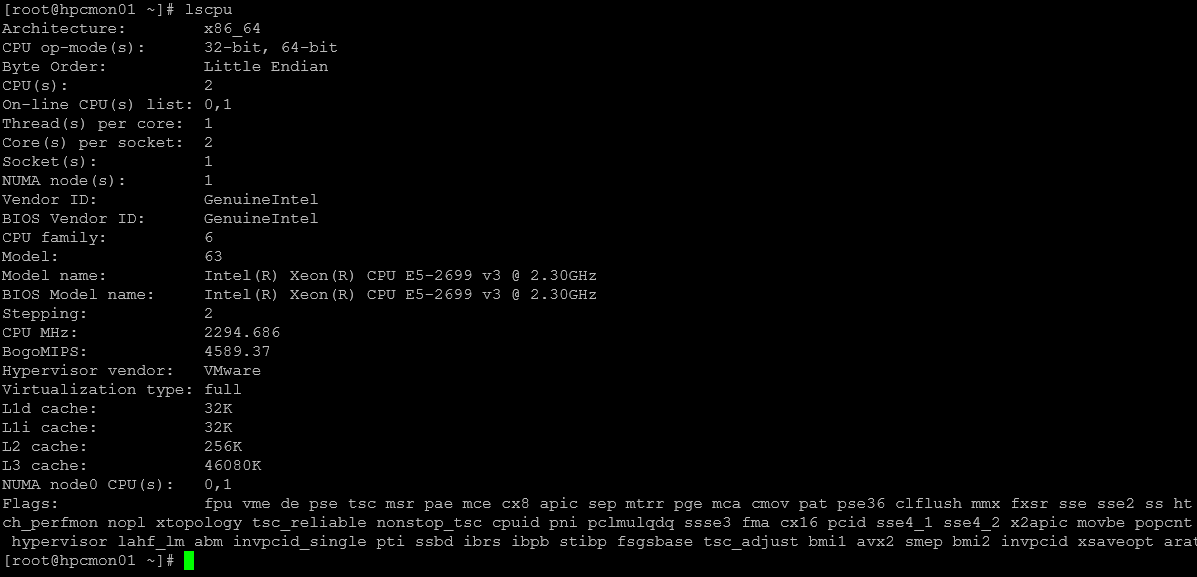
On a server with four logical CPUs, a load average around 4.00 may indicate that the CPUs are fully utilized when the workload is primarily CPU-bound.
However, load average also includes tasks in uninterruptible sleep, commonly associated with I/O waits. For this reason, a load of 4.00 does not by itself prove that all four CPUs are busy.
Correlate load average with CPU utilization, process states, vmstat, and storage metrics before identifying the bottleneck.
A value consistently above 4.00 suggests that some tasks are waiting to execute or are blocked by I/O.
The relationship between the three load values is also important:
- If the 1-minute value is much higher than the 15-minute value, the workload has recently increased.
- If all three values remain high, the system has experienced sustained pressure.
A high load average combined with low CPU utilization often points to storage, NFS, or another I/O-related problem rather than processor saturation.
Investigating CPU Consumption
CPU analysis is an important part of Linux process resource usage troubleshooting. It helps determine whether an application is performing legitimate work, suffering from a software problem, or competing for limited processor time.
The most common interactive command is:
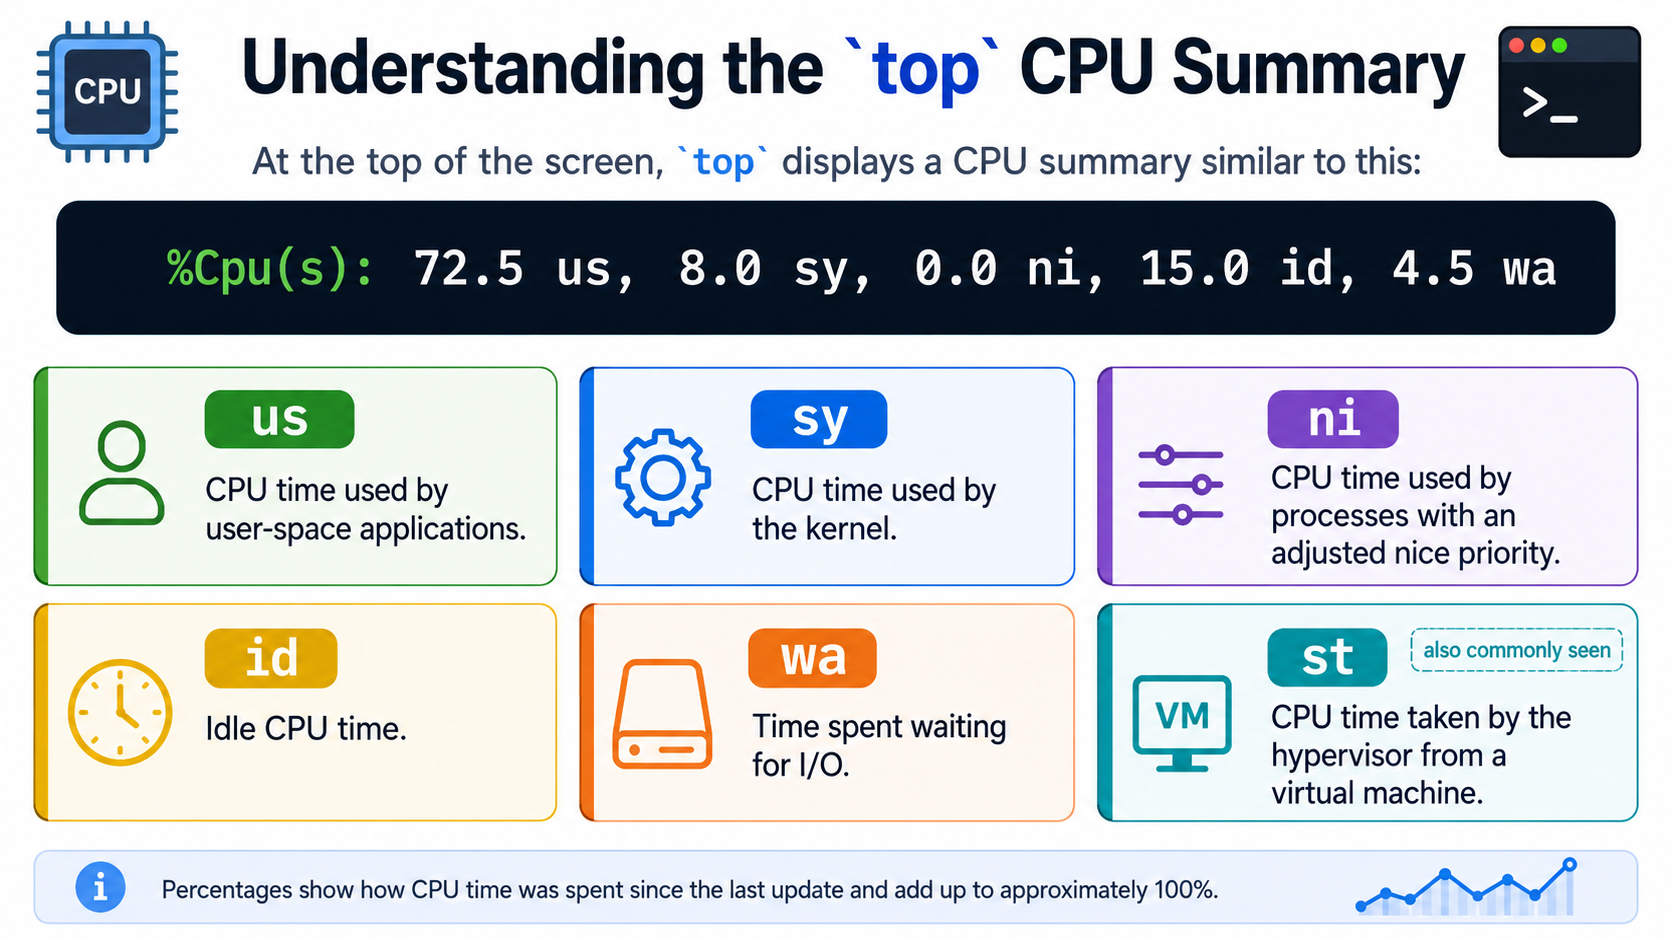
topAt the top of the screen, top displays a CPU summary similar to this:
%Cpu(s): 72.5 us, 8.0 sy, 0.0 ni, 15.0 id, 4.5 waThe most useful fields are:
us: CPU time used by user-space applications.sy: CPU time used by the kernel.ni: CPU time used by processes with an adjusted nice priority.id: idle CPU time.wa: time spent waiting for I/O.st: CPU time taken by the hypervisor from a virtual machine.
High us usage normally means that applications are performing intensive calculations. This may be expected during compression, compilation, report generation, database processing, or application indexing, for example.
High sy usage indicates that significant time is being spent inside the kernel. Possible causes include heavy network traffic, frequent system calls, storage operations, firewall processing, or driver problems.
High wa does not mean that the processor itself is overloaded. It means the CPUs are frequently idle while waiting for I/O operations to complete.
In a virtual machine, a high st value may indicate CPU contention on the virtualization host. The guest operating system is ready to run, but the hypervisor is not providing enough physical CPU time.
Press P inside top to sort processes by CPU usage. The %CPU column shows how much processor time each process consumes.
On multicore systems, a process can exceed 100 percent:
- For example, a process using 300 percent is consuming the equivalent of three logical CPUs.
For a noninteractive list, run:
ps -eo pid,ppid,user,comm,%cpu,%mem --sort=-%cpu | head -15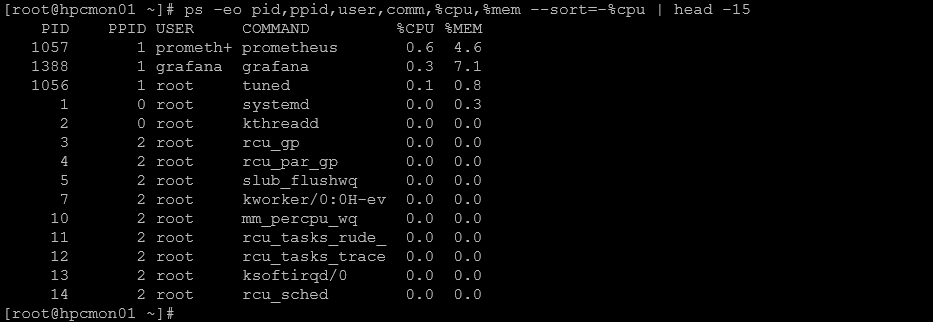
Keep in mind that %CPU reported by ps is based on CPU usage over the lifetime of the process. It is useful for a quick ranking, but it may not expose a process that has only recently started consuming CPU.
Use top or repeated pidstat samples when you need to confirm current sustained CPU activity.
To inspect a specific process:
ps -p 1057 -o pid,ppid,user,etime,stat,%cpu,%mem,cmd
Replace 1057 with the target PID. The etime field shows how long the process has been running, while stat displays its current state.
Common process states include:
R: running or ready to run.S: interruptible sleep.D: uninterruptible sleep, usually related to I/O.Z: zombie process.T: stopped or traced process.
A process appearing at the top of a single snapshot is not necessarily faulty. Use pidstat, provided by the sysstat package, to collect repeated measurements.
If the command is not available, install the package on RHEL-based distributions with:
dnf install sysstat -yOn older systems that still use yum, run:
yum install sysstat -yThen collect ten samples at two-second intervals:
pidstat 2 10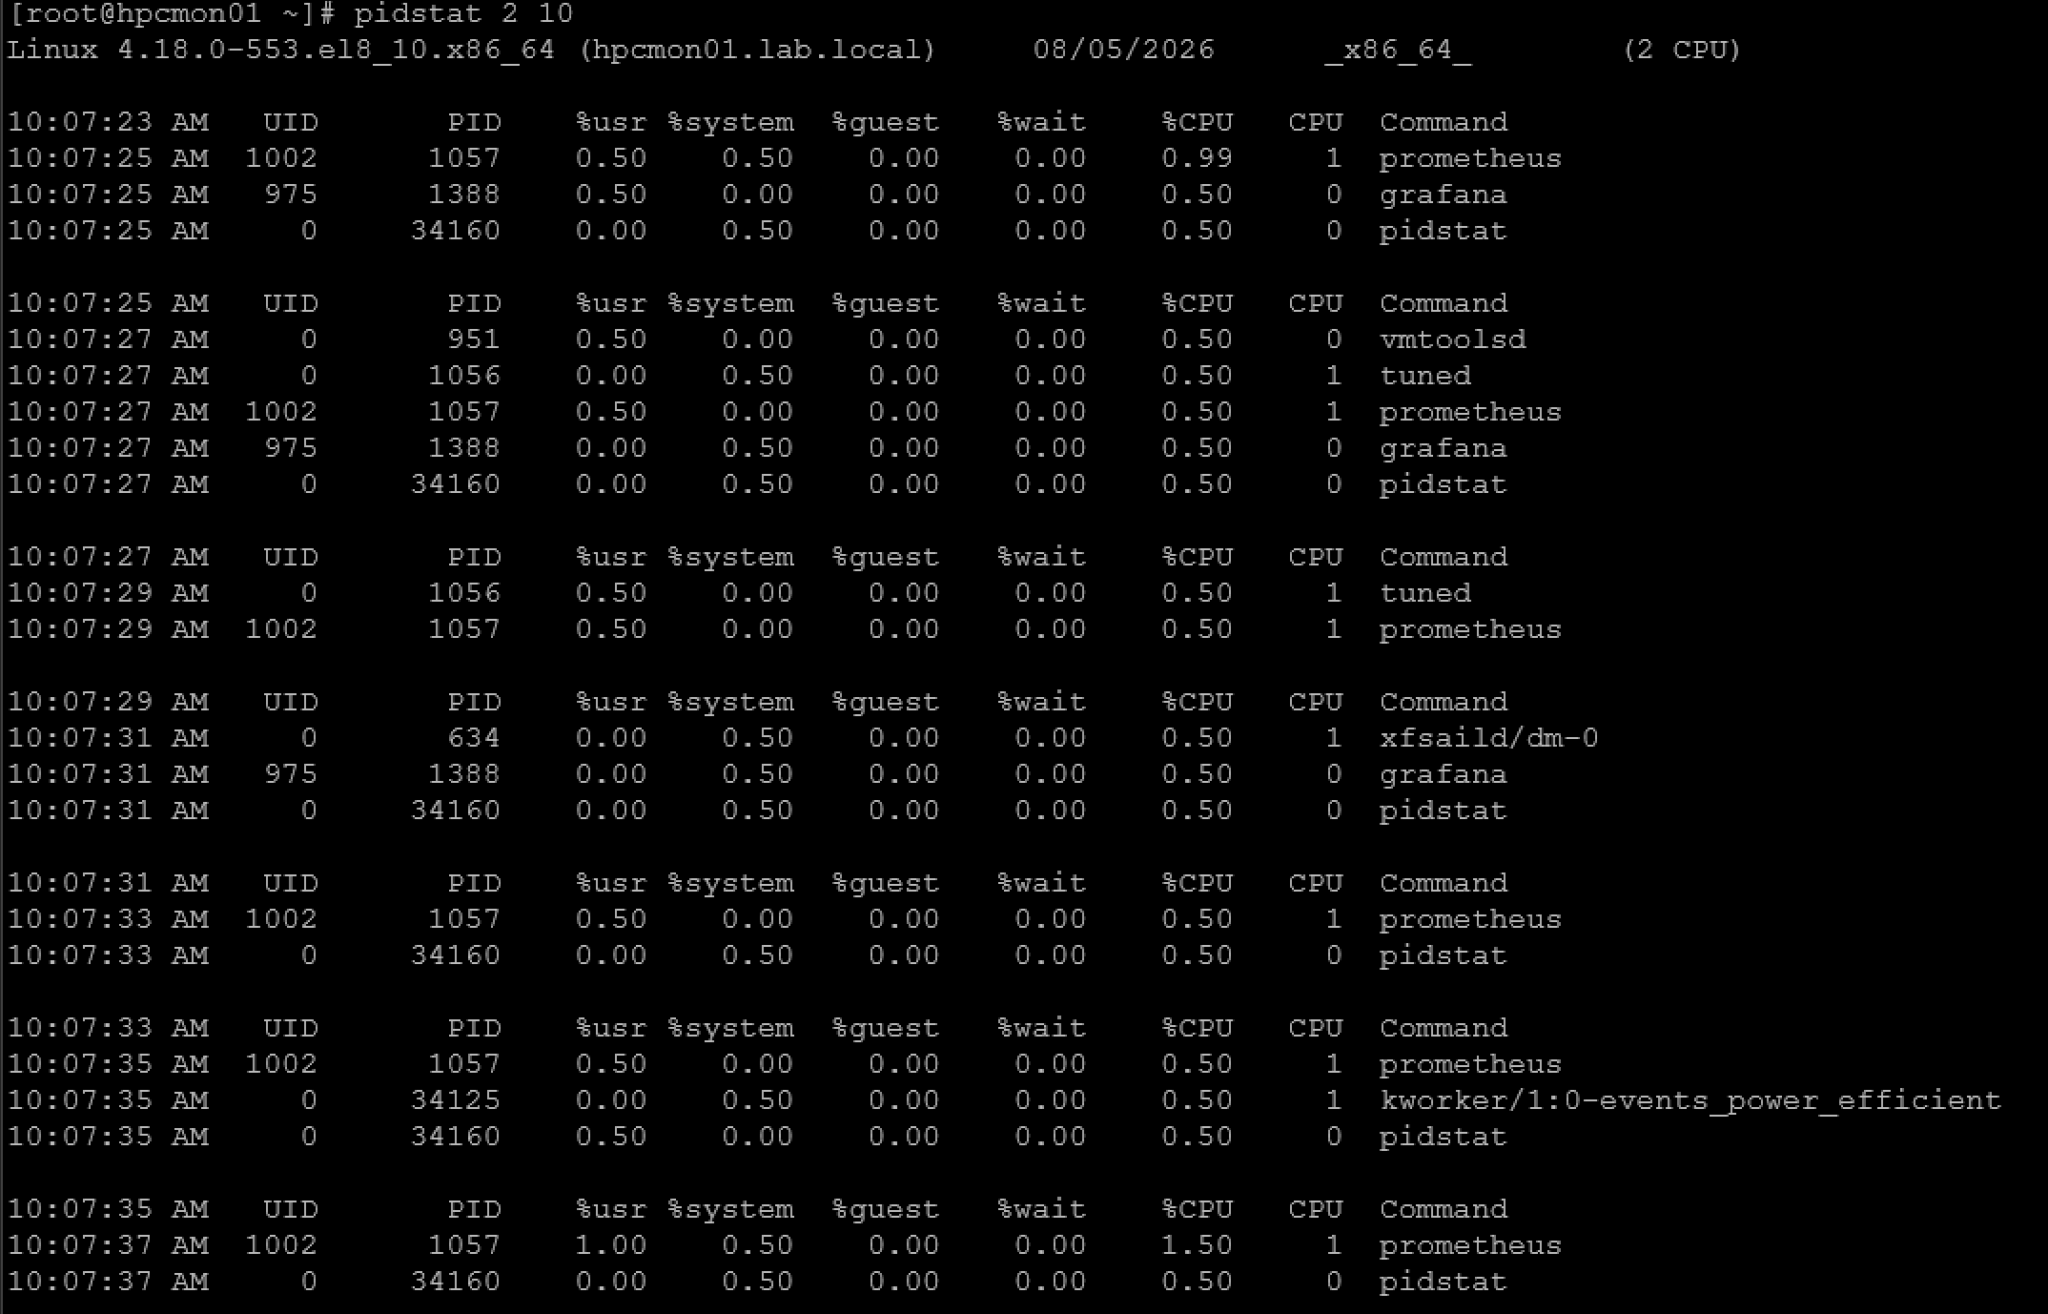
This command collects ten samples at two-second intervals. It is useful for distinguishing short CPU spikes from sustained consumption.
When high CPU usage is confirmed, possible actions include reducing application workers, rescheduling intensive jobs, reviewing application logs, fixing runaway loops, or adjusting process priority.
To lower the scheduling priority of a running process:
sudo renice +10 -p 1057Note: This sets the process nice value to +10 on the standard Linux renice implementation; it does not necessarily mean “add 10 to the current value.” A higher nice value gives the process less scheduling preference under the normal time-sharing scheduler.
For a deeper explanation of nice values and process scheduling priority, see “Understanding Process Priorities on Linux“.
Understanding Memory Usage
Memory metrics must be interpreted carefully because Linux uses unused RAM for filesystem cache. High memory utilization alone does not prove that the server is experiencing memory pressure.
Start with:
free -hExample:
               total        used        free       shared      buff/cache    available
Mem:            15Gi        9.1Gi       620Mi       410Mi        5.3Gi        5.7Gi
Swap:          2.0Gi       256Mi       1.7Gi
The free column shows completely unused memory, but it is not the best indicator of system health. The available column estimates how much memory can be allocated without causing heavy swapping.
A server with little free memory but several gigabytes available is usually operating normally. Linux can release cache when applications require additional RAM.
Real memory pressure is more likely when available memory remains low, swap usage grows continuously, application response time increases, or the Out-of-Memory killer starts terminating processes.

List the largest memory consumers with:
ps -eo pid,user,comm,%mem,rss,vsz --sort=-rss | head -15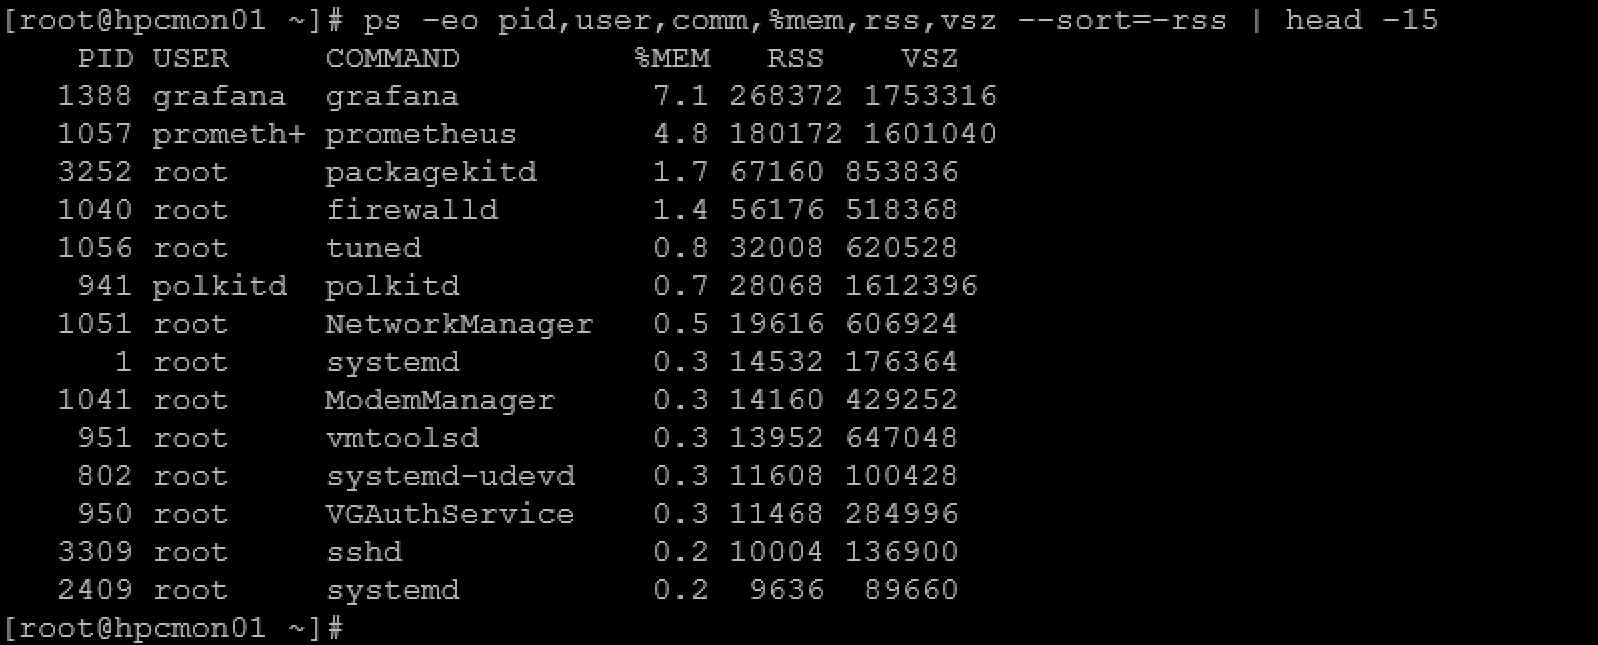
RSS represents the non-swapped physical memory currently resident for the process. Keep in mind that RSS can include shared pages, so it should not always be interpreted as memory exclusively owned by that process.
A high VSZ value does not necessarily mean that the process is consuming the same amount of physical memory. For most initial investigations, RSS is the more useful metric.
Inspect a process through the /proc filesystem – In this case, for instance, the Process ID (PID) is 1057. Replace it with your PID value:
grep -E 'Name|VmRSS|VmSize|VmSwap|Threads' /proc/1057/status
Important values include:
VmRSS: physical memory currently used.VmSize: total virtual memory allocated.VmSwap: process memory stored in swap.Threads: number of process threads.
Note: This approach is an excellent way to know if a specific PID is using swap memory, for example!
Use vmstat to observe memory and process behavior over time:
vmstat 2 10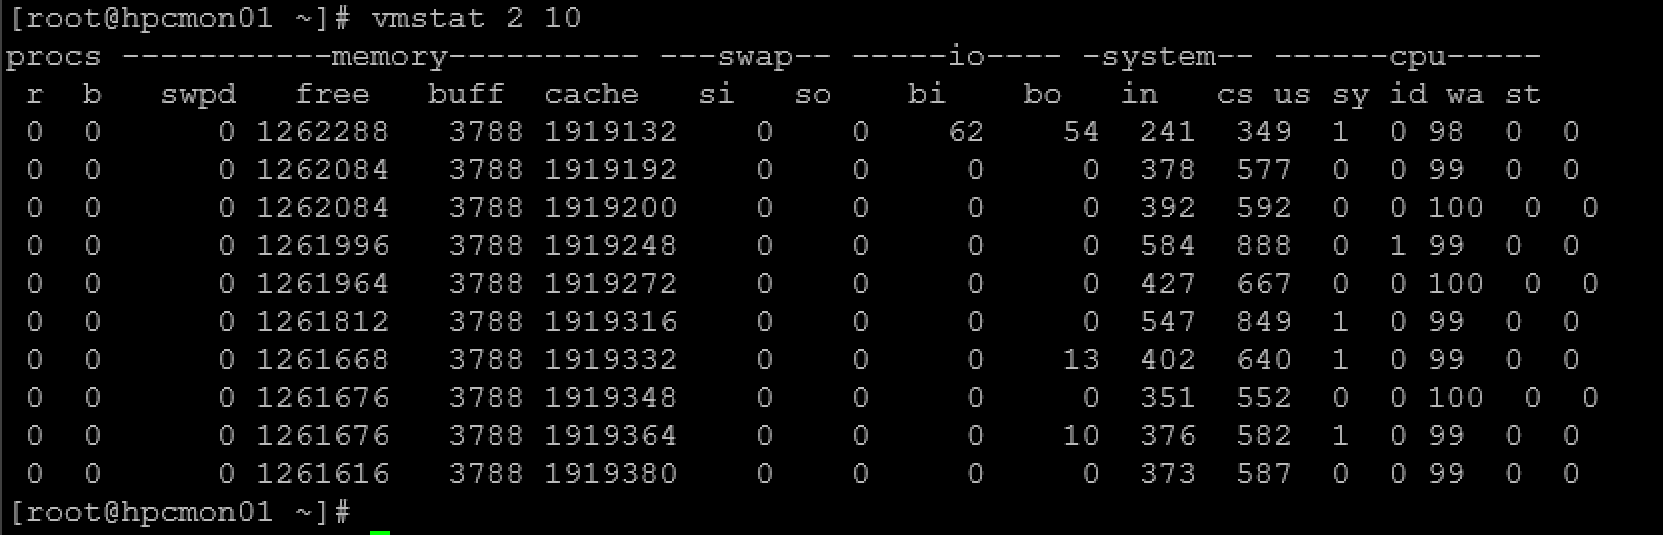
Pay attention to the following columns:
r: processes waiting for CPU time.b: processes blocked by I/O.si: memory read from swap.so: memory written to swap.wa: CPU time waiting for I/O.
Having data in swap is not automatically a problem. Linux may move rarely used pages to swap and keep useful filesystem data in memory.
Continuous nonzero values in si and so, combined with poor system responsiveness, indicate active swapping. This behavior can create significant disk activity and application delays.
To monitor process memory consumption repeatedly, use:
pidstat -r 5If the RSS value of a process continues to grow without returning to a normal level, the application may have a memory leak, an oversized cache, too many workers, or an incorrect heap configuration.
Corrective actions may include limiting worker processes, adjusting application caches, reviewing Java heap settings, restarting a confirmed leaking service, updating the application, or adding RAM when the workload is valid.
⚠️ Caution: Avoid dropping the Linux filesystem cache as a routine fix because the kernel automatically reclaims cached memory when applications need it. Clearing the cache may also cause a temporary increase in disk activity and application latency, as frequently accessed data must be loaded again.
If releasing cached memory is the only practical emergency action, first flush pending writes to disk and then use the appropriate drop_caches value:
sync
echo 1 > /proc/sys/vm/drop_caches
The value 1 releases the page cache. Use 2 to release reclaimable entries and inodes, or 3 to release both:
sync
echo 3 > /proc/sys/vm/drop_caches
Check free -h and /proc/meminfo before and after the operation. Keep in mind that this procedure does not release memory actively used by processes and should not replace the investigation of memory leaks, oversized application caches, or incorrect service configurations.
If the server has available memory but continues using swap, see “Linux Server Has Free Memory but Is Swapping: Why?“ for a deeper analysis of Linux reclaim and swap behavior.
Finding Processes Causing Disk Activity
Disk troubleshooting must separate capacity problems from performance problems. A filesystem can have sufficient free space while the underlying storage is overloaded, and a fast disk can still fail because its filesystem is full.
Check filesystem capacity with:
df -hT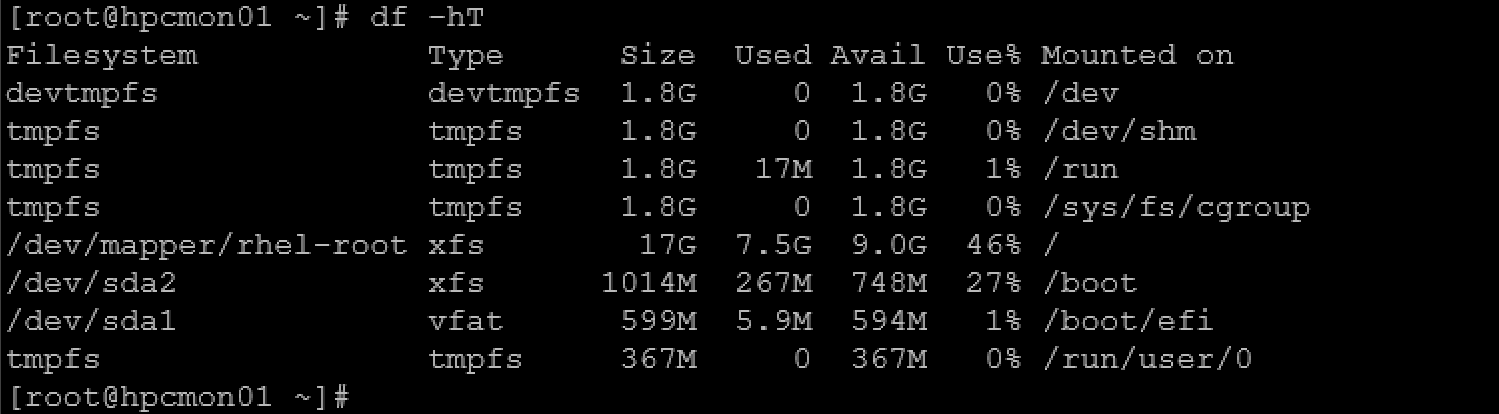
The command shows the filesystem type, total capacity, used space, available space, and mount point.
A filesystem approaching 100 percent can cause application failures, package installation errors, logging problems, and database interruptions, for example.
To find large directories under /var, run:
sudo du -xhd1 /var | sort -rh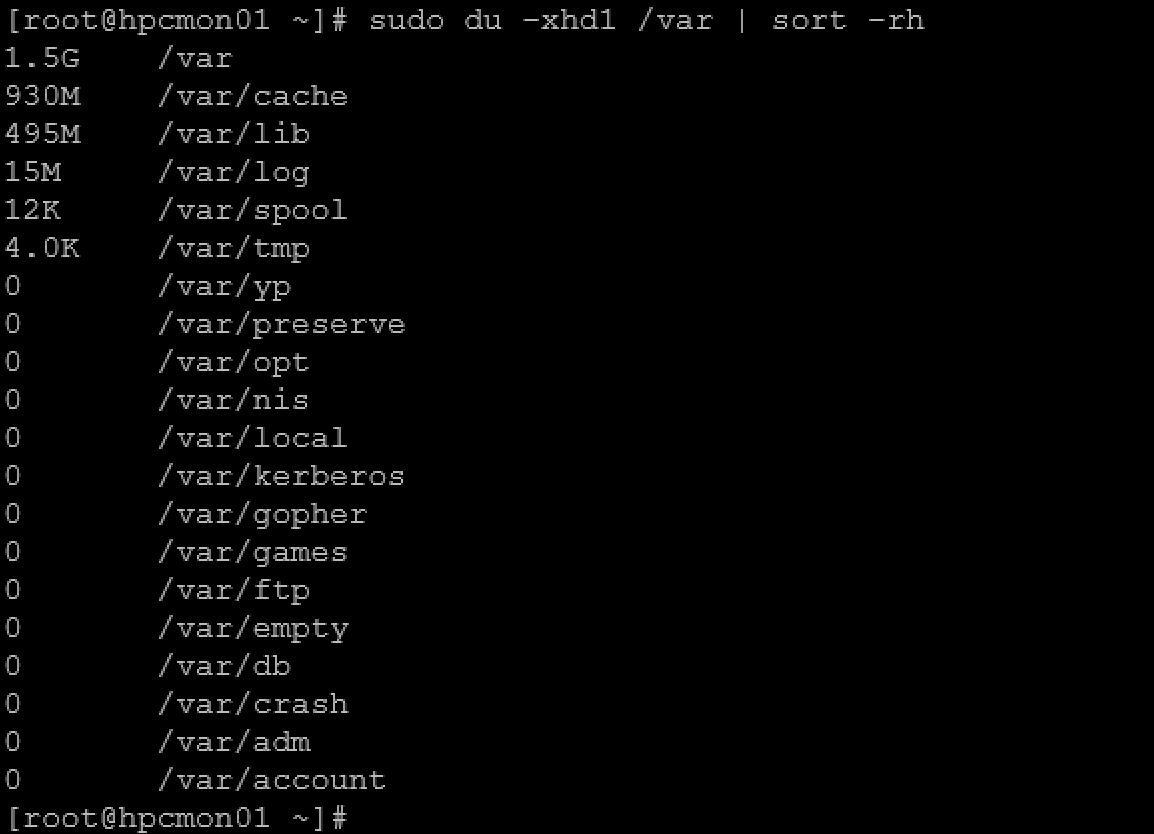
The -x option prevents du from crossing into other filesystems. Continue running the command inside the largest directories until the source of the growth is identified.
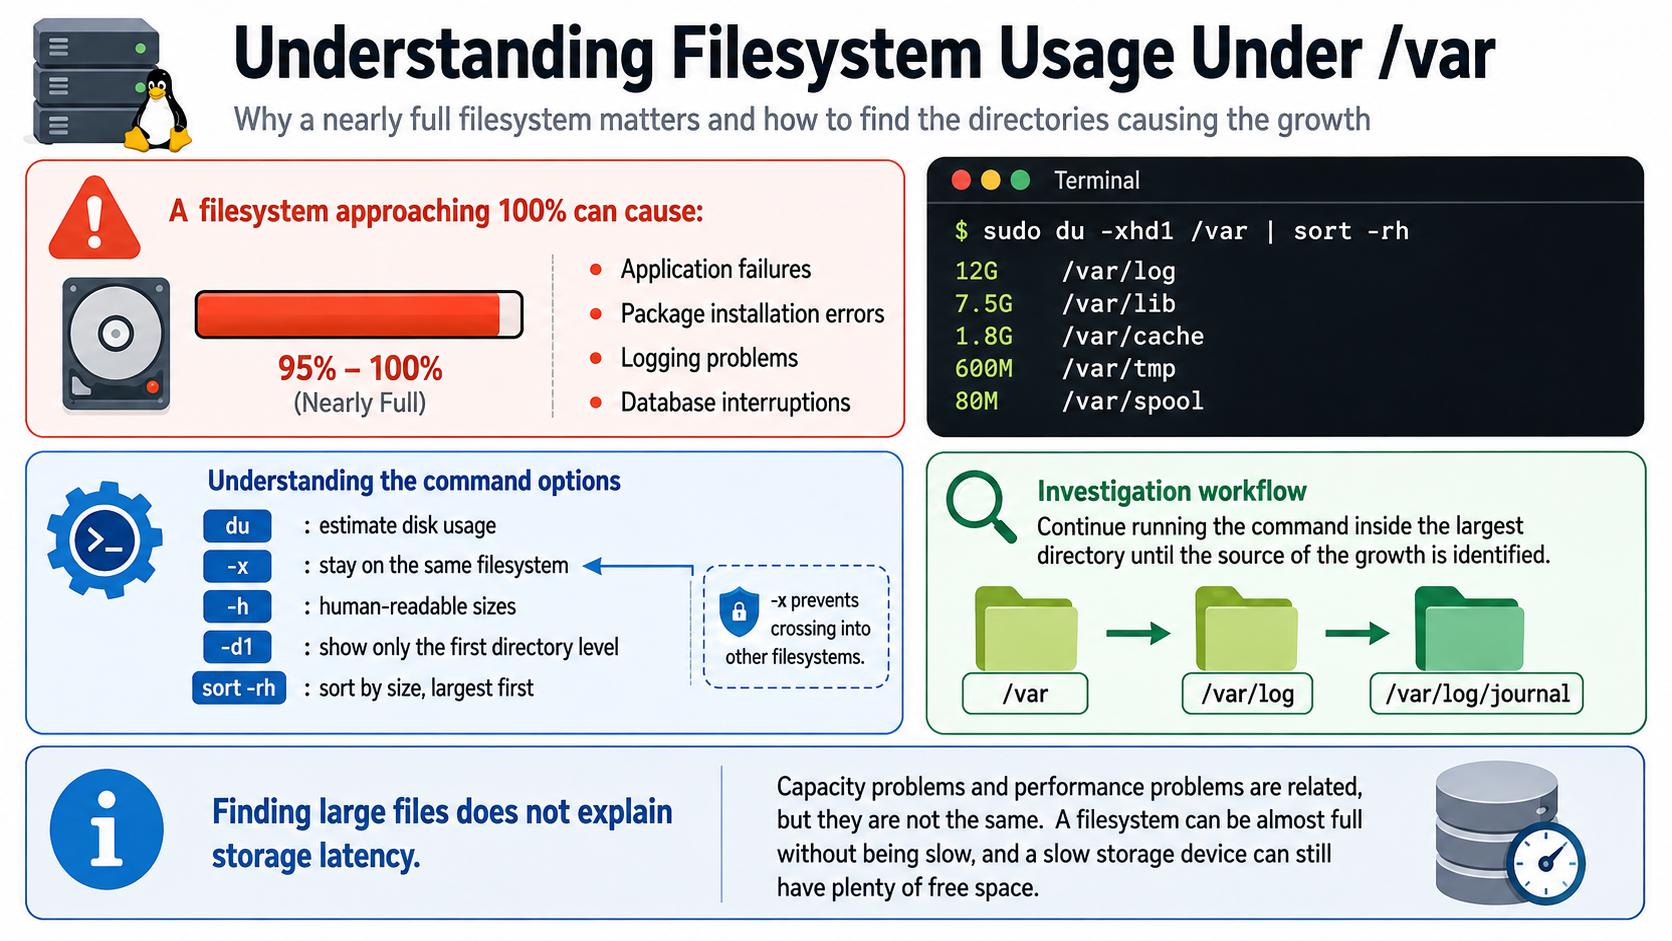
Finding large files does not explain storage latency. For performance analysis, use:
iostat -xz 2 4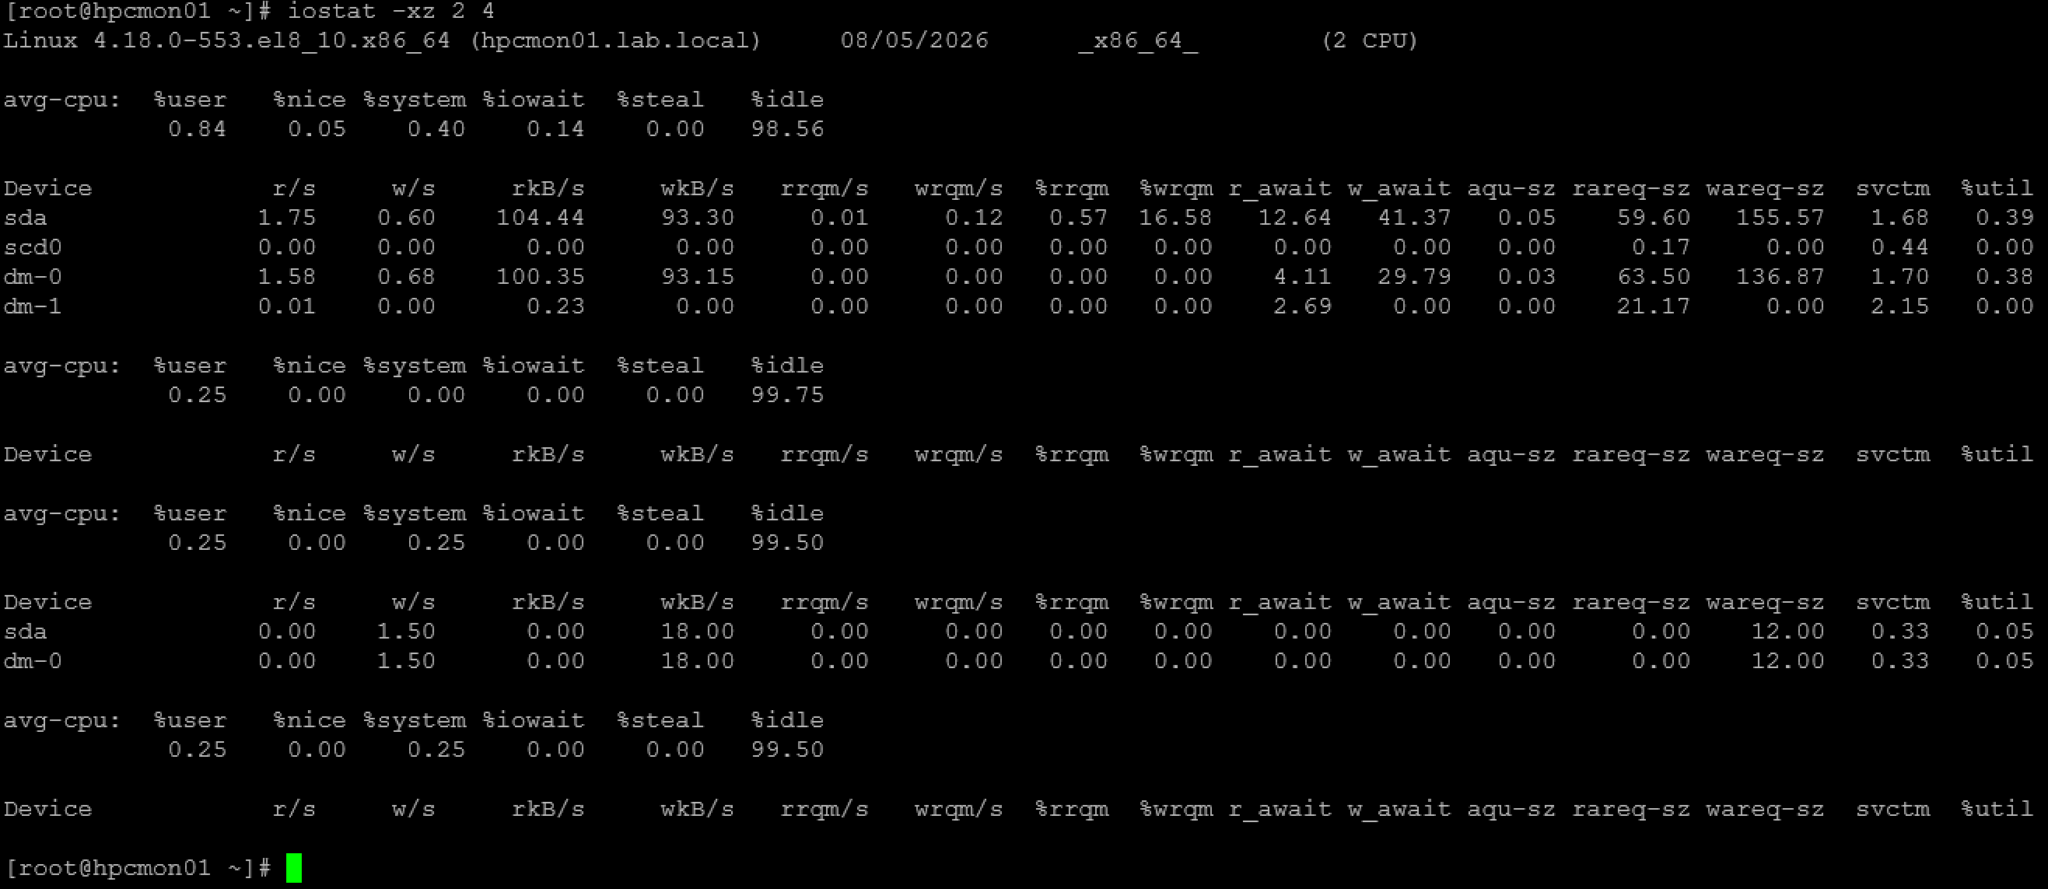
Important fields include:
r/sandw/s: read and write operations per second.rkB/sandwkB/s: read and write throughput.await: average I/O request latency.avgqu-sz: average number of requests in the queue.%util: percentage of time the device was busy.
High %util combined with rising await and queue length normally indicates storage saturation. However, %util should be interpreted carefully on SSDs, storage arrays, multipath devices, and virtual disks because they may process several operations in parallel.
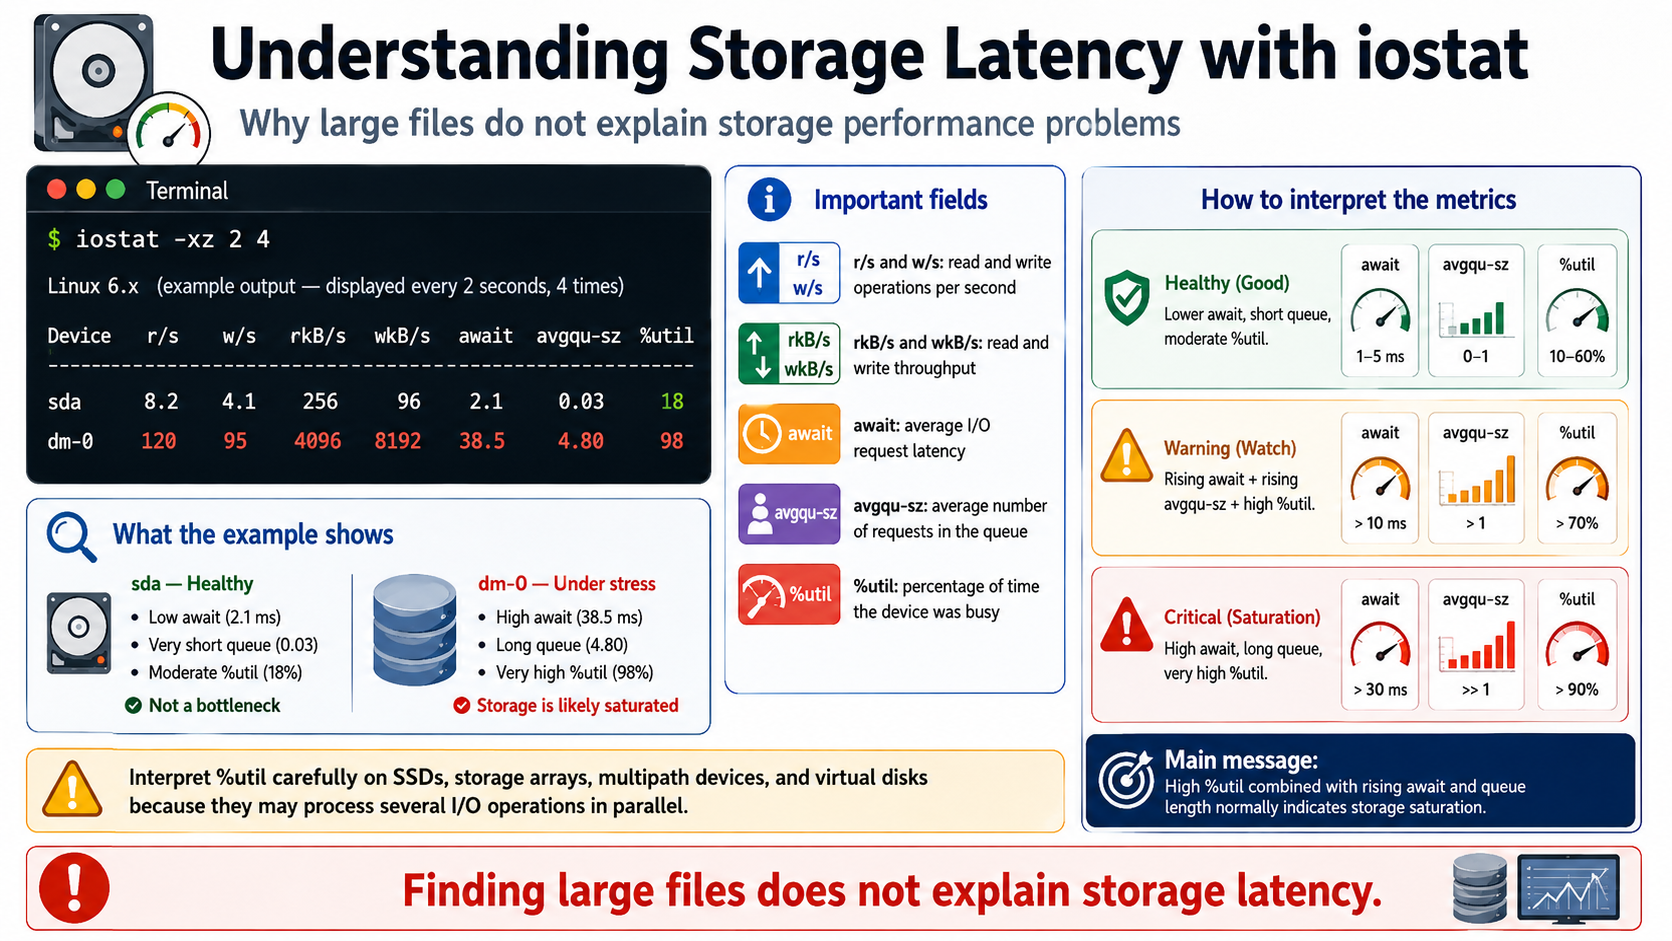
To identify processes actively performing disk I/O, use iotop. On RHEL-based systems, install it first if the command is not available:
dnf install iotop -yThen run:
iotop -oPa
The -o option displays only processes currently performing I/O, -P groups activity by process instead of individual threads, and -a shows accumulated read and write activity since iotop was started.
If iotop cannot be installed, pidstat provides a useful alternative:
pidstat -d -p ALL 2 10This report per-process disk read and write rates at two-second intervals, allowing sustained storage activity to be distinguished from brief I/O spikes.
Processes in state D are waiting for an operation that cannot be interrupted. Find them with:
ps -eo pid,state,wchan:32,comm | awk '$2=="D"'💡 Important: Several processes stuck in state D may indicate slow storage, a disconnected NFS mount, a failed disk path, filesystem problems, or an overloaded virtual storage device.
Possible corrections include rotating large logs, removing unnecessary files, tuning database queries, creating missing indexes, rescheduling backups, limiting concurrent jobs, or investigating the RAID, SAN, NFS server, cloud volume, or hypervisor storage layer.
Identifying Network-Heavy Processes
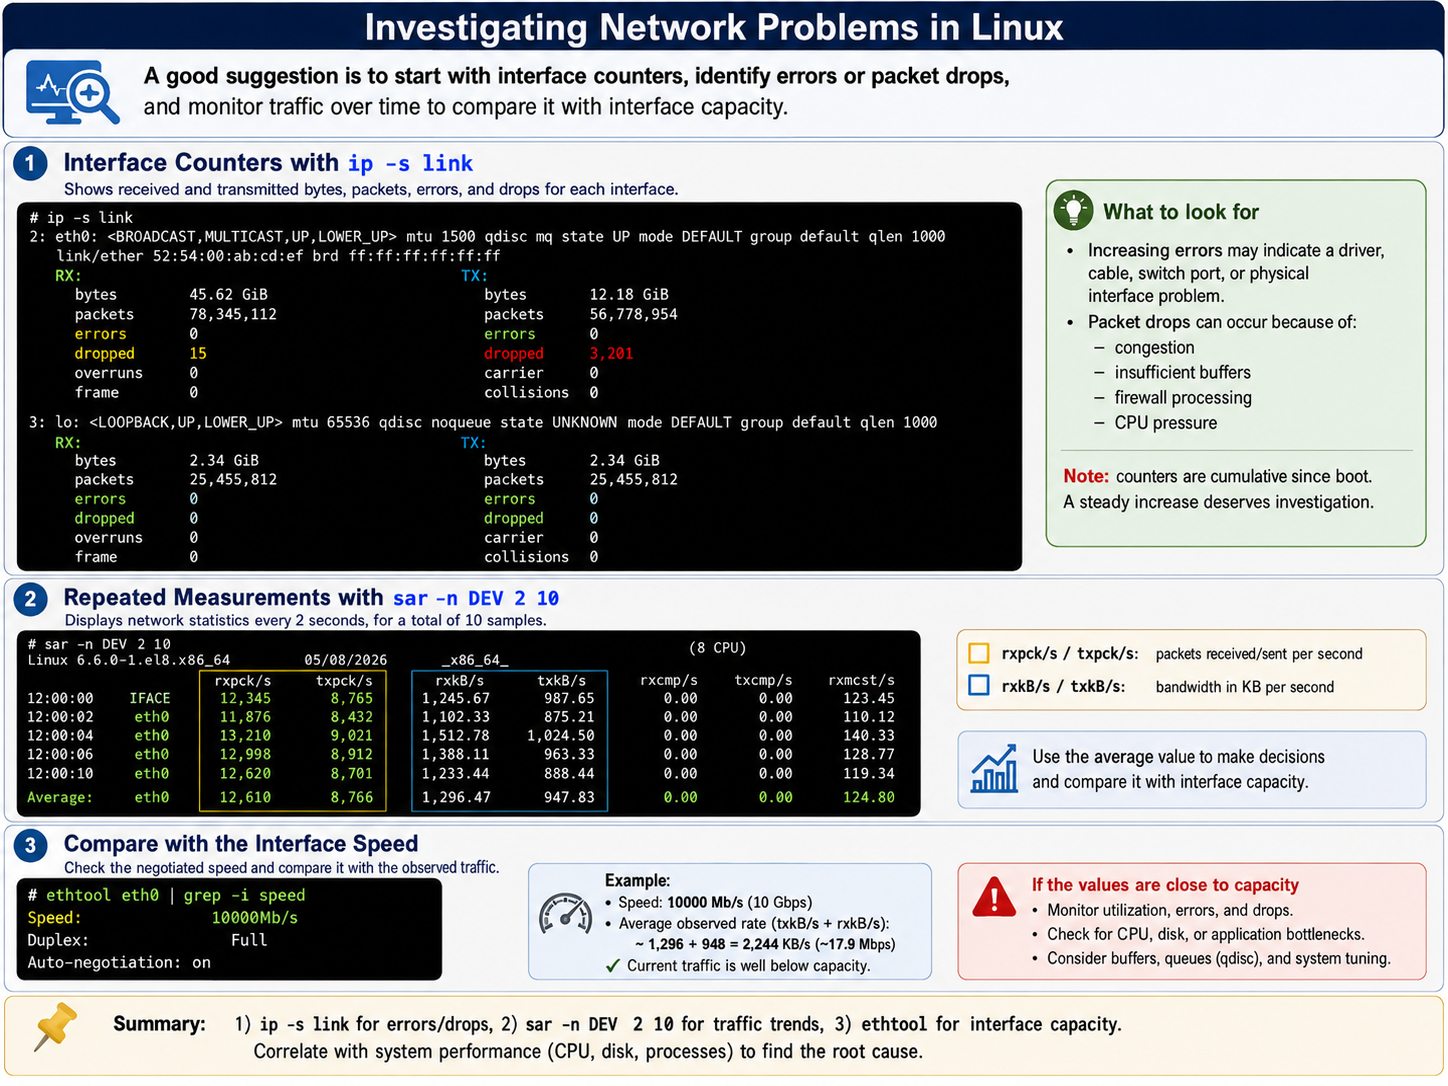
Network investigation should begin with interface counters:
ip -s link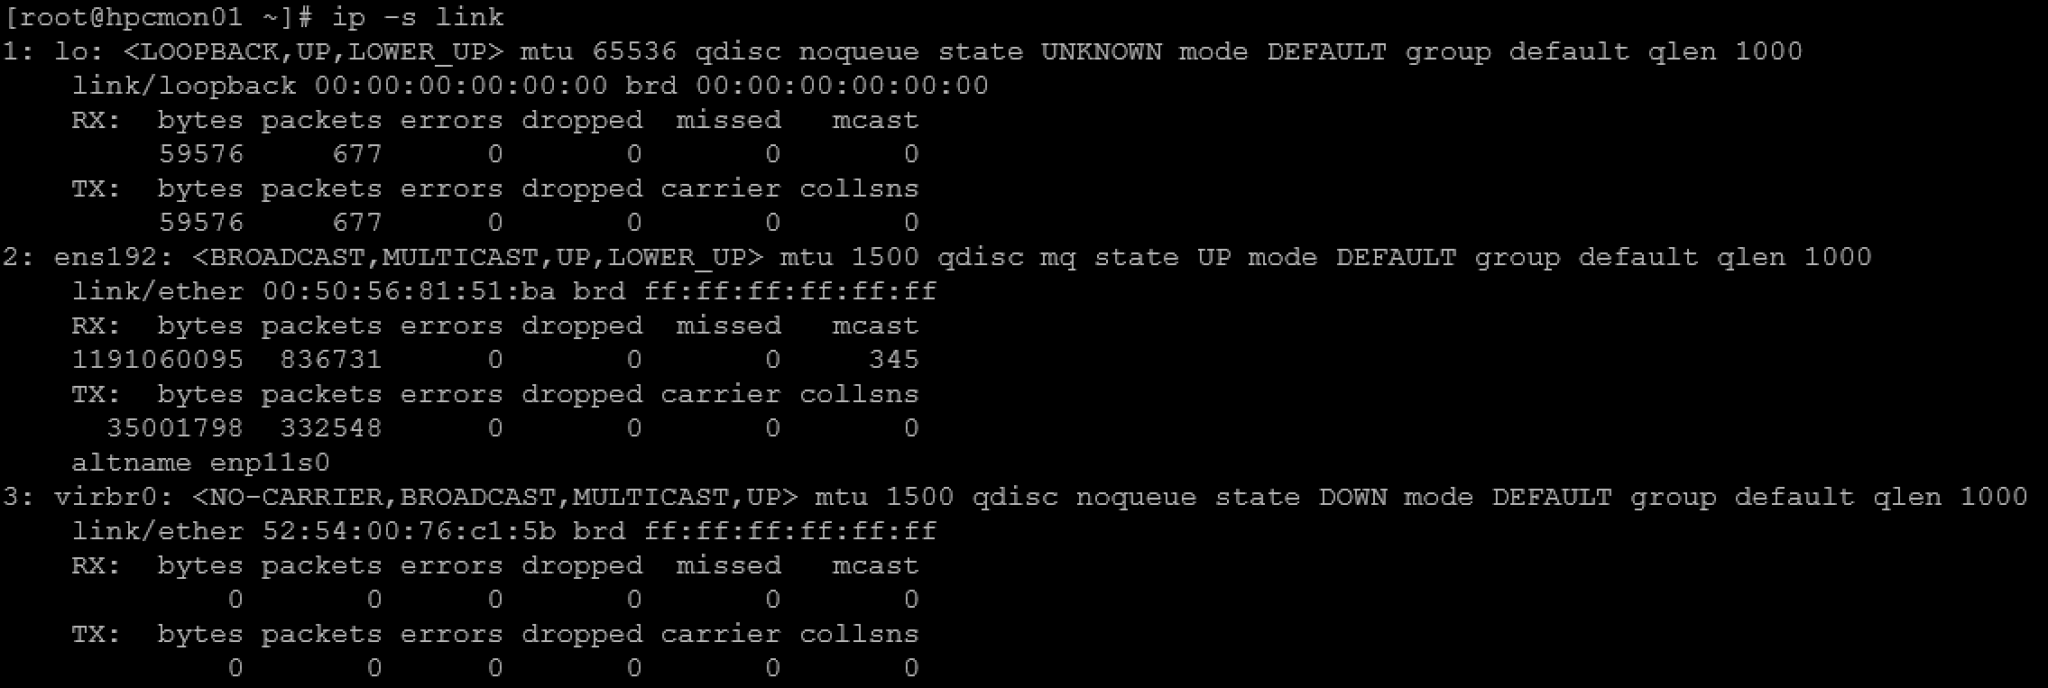
This command displays received and transmitted bytes, packets, errors, and dropped packets for each interface.
A steadily increasing number of errors may indicate a driver, cable, switch port, or physical interface problem. Packet drops can also occur because of congestion, insufficient buffers, firewall processing, or CPU pressure.
Use sar for repeated interface measurements:
sar -n DEV 2 10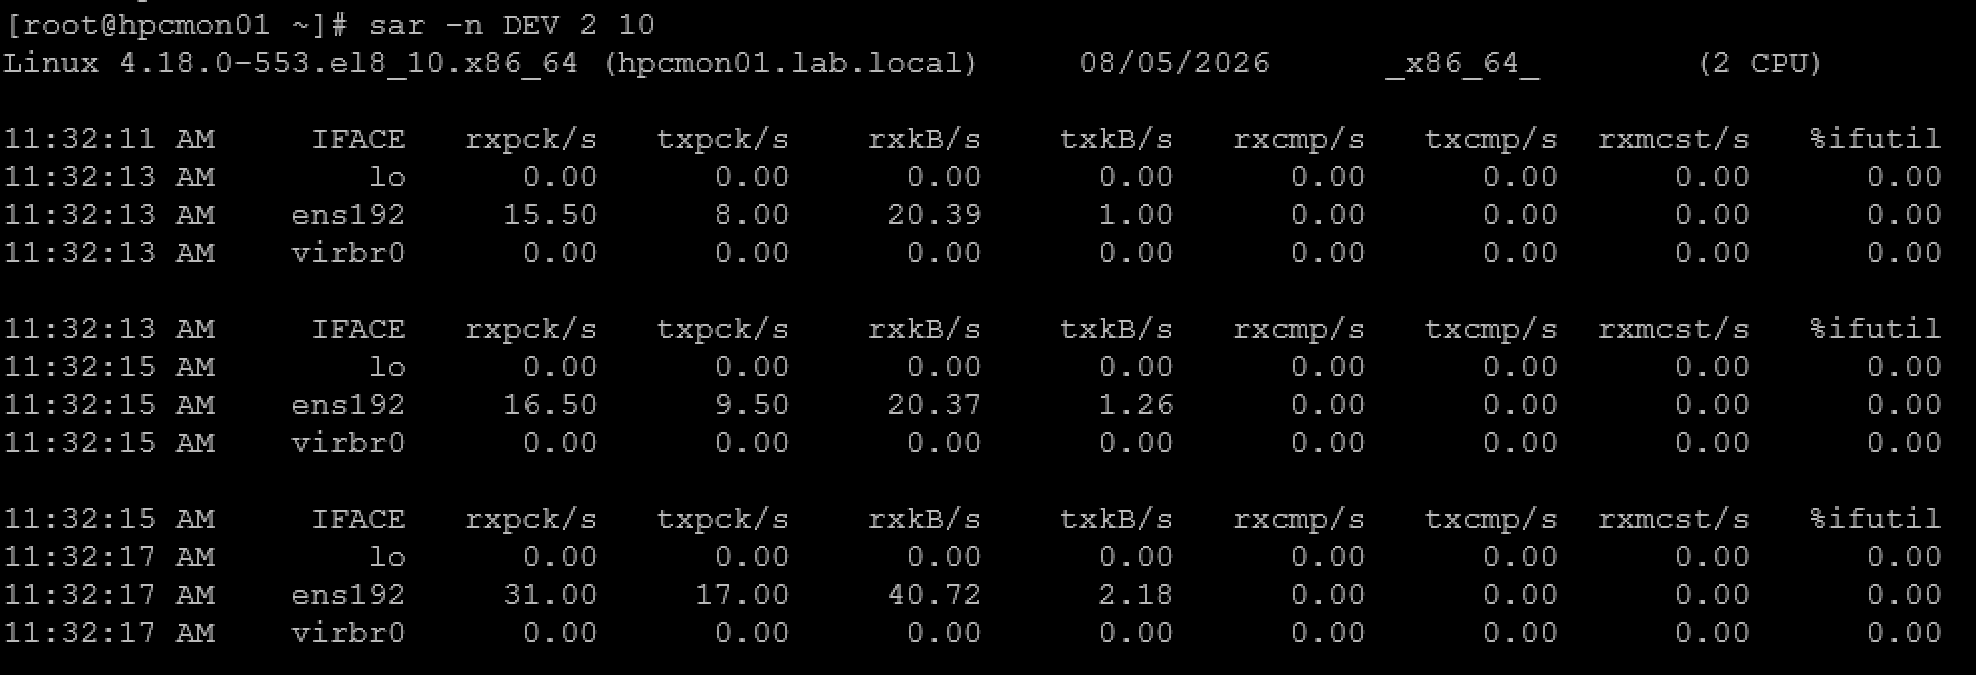
The most useful fields normally include receive and transmit packets per second and bandwidth values such as rxkB/s and txkB/s.
Compare the observed traffic with the speed of the network interface:
ethtool eth0 | grep -i speedReplace eth0 with the correct interface name. In our case, for instance:

To display active sockets and their owning processes, run:
sudo ss -tunap
The command lists TCP and UDP sockets, local and remote addresses, connection states, and process information.
To focus on established TCP sessions:
sudo ss -tnp state establishedFor live bandwidth consumption by process, use nethogs. On RHEL 8, the package is normally available through the EPEL repository:
dnf install \
  https://dl.fedoraproject.org/pub/epel/epel-release-latest-8.noarch.rpm \
  -y
dnf install nethogs -y
Then identify the active network interface:
ip -br linkStart NetHogs on the required interface:
nethogs ens192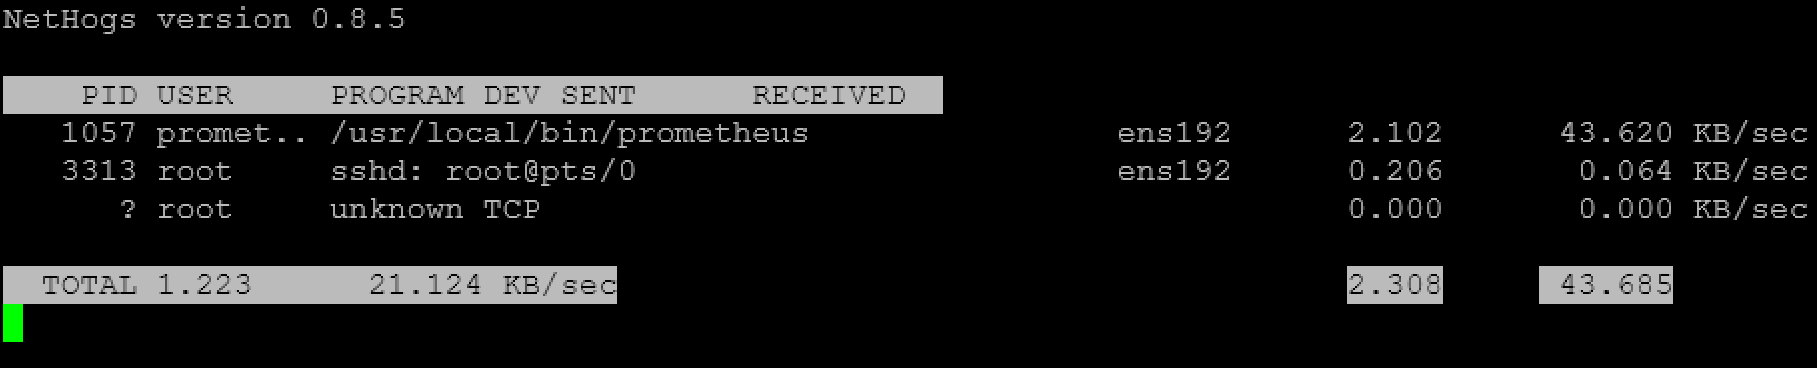
Replace ens192 with the appropriate interface name. NetHogs groups current network traffic by process and displays the sending and receiving rates for each application.
In HPC environments, keep in mind that NetHogs primarily monitors IP traffic. Native RDMA or other traffic (InfiniBand, for example) that bypasses the regular TCP/IP stack may not be attributed correctly to processes.
To identify which hosts are exchanging the most traffic, run:
dnf install iftop -y
sudo iftop -i ens192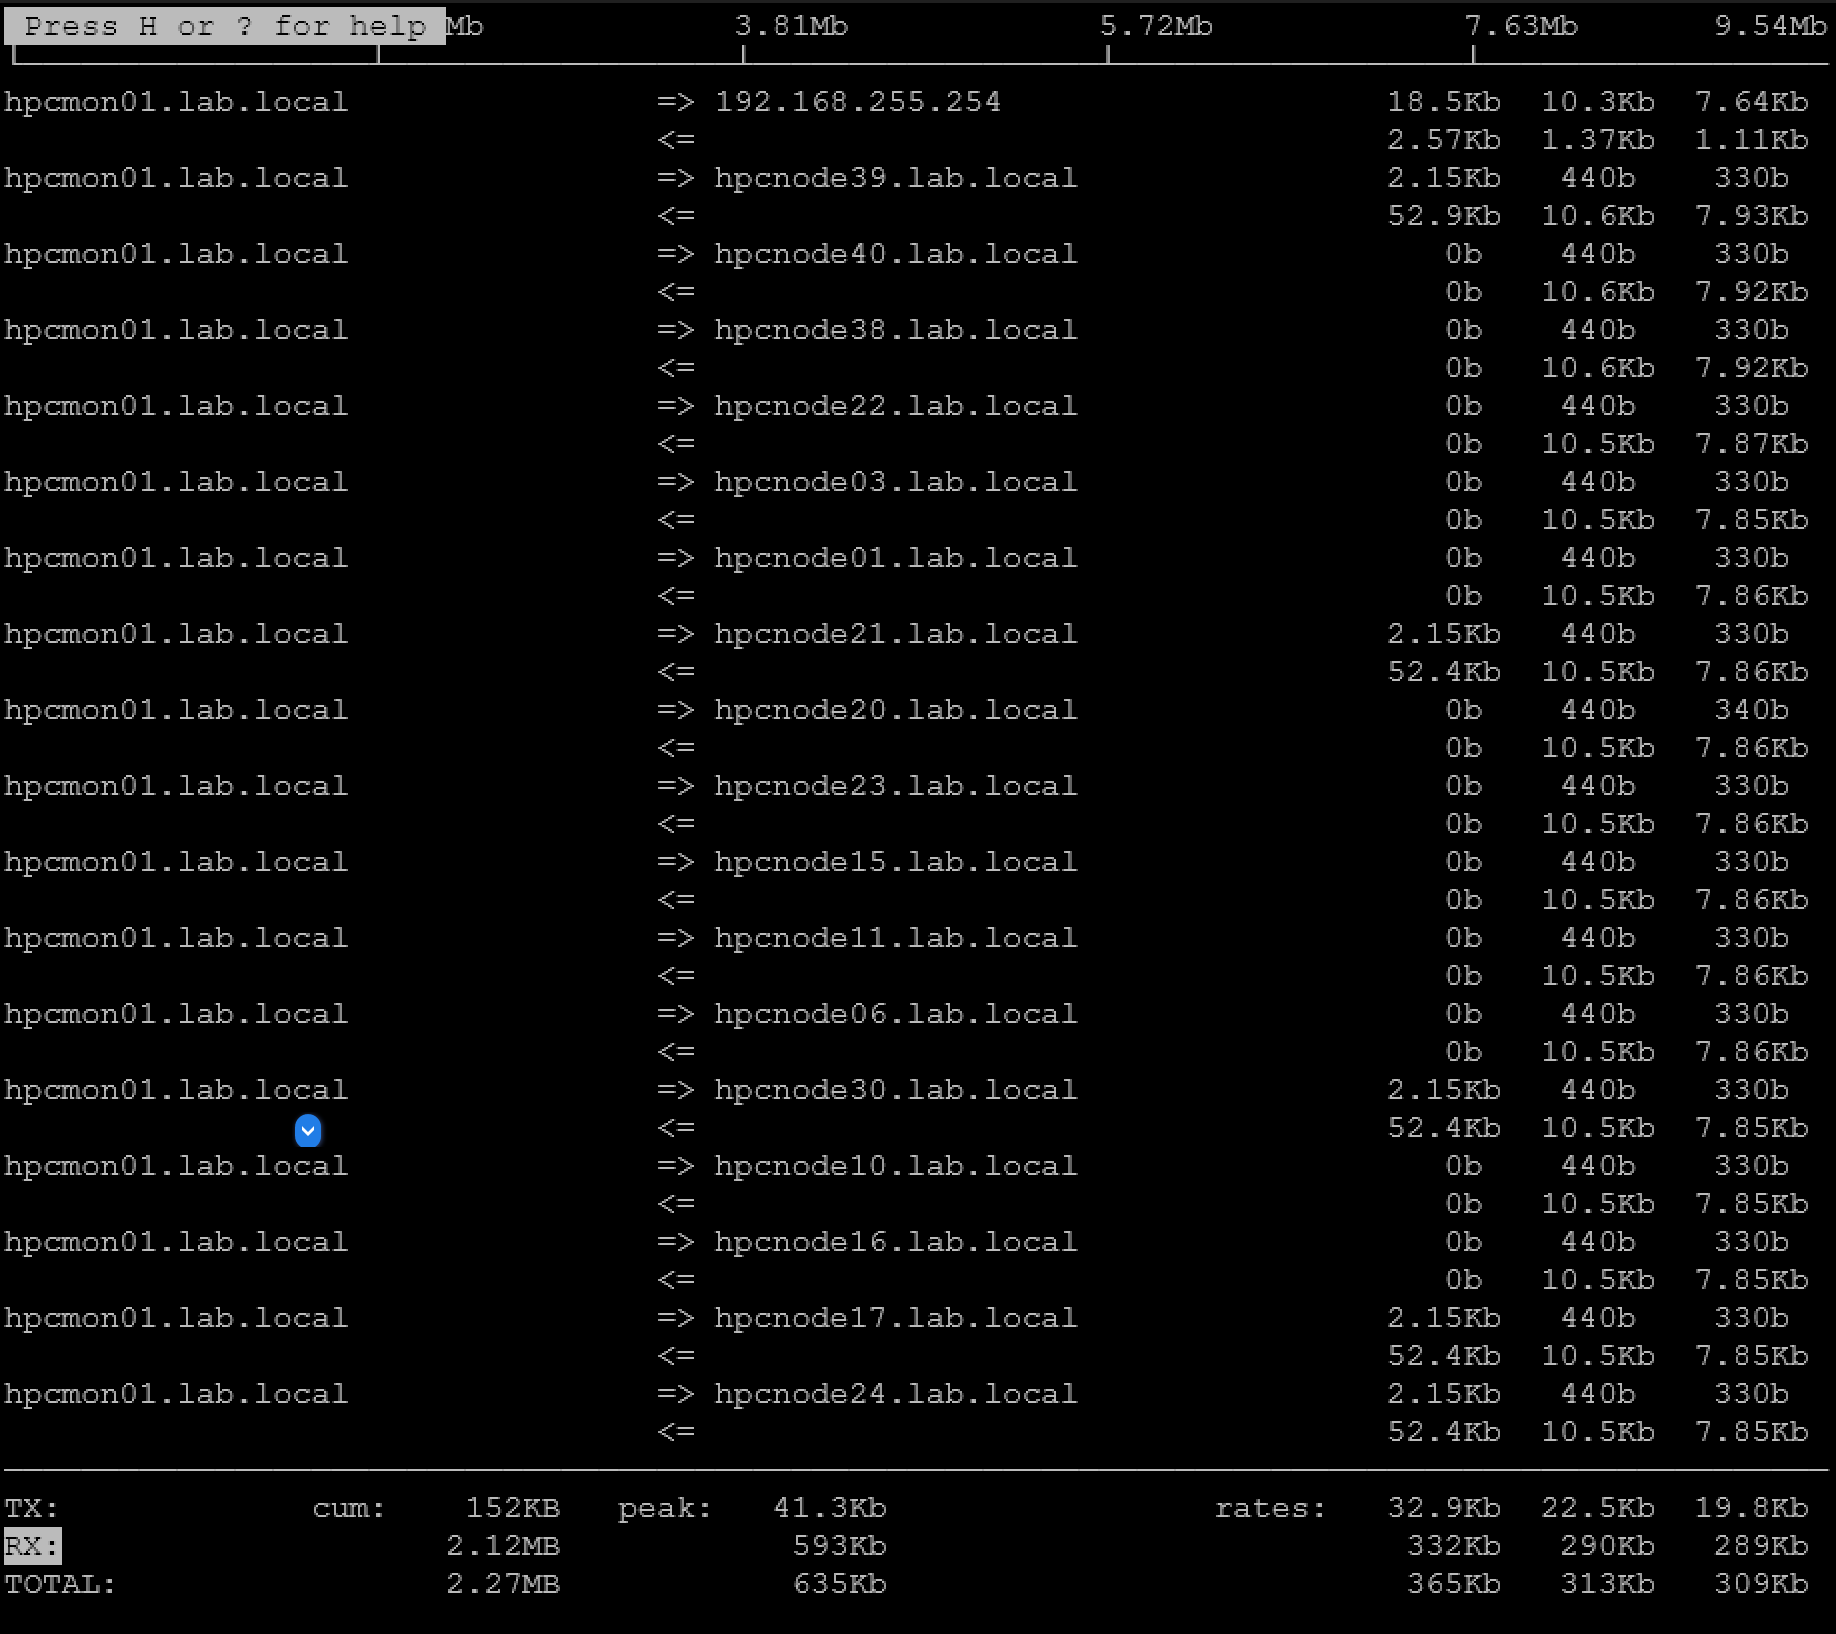
Unexpected traffic may be caused by backups, replication, package downloads, log forwarding, application synchronization, compromised processes, or incorrectly configured services, for example.
Check TCP retransmissions with:
nstat -az | grep -i retrans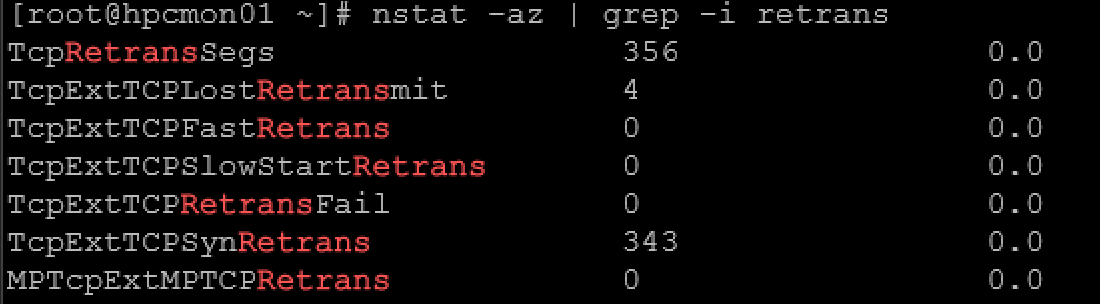
A growing retransmission count may indicate congestion, packet loss, an MTU mismatch, unstable network paths, or overloaded remote systems.
Possible corrective actions include limiting transfer rates, rescheduling backups, tuning connection pools, correcting MTU settings, reviewing firewall rules, inspecting remote endpoints, or separating heavy traffic across dedicated interfaces.
If retransmissions continue increasing, see “How to Investigate TCP Retransmissions on Linux“ for a TCP-specific troubleshooting workflow.
Build a Reliable Troubleshooting Workflow
A reliable Linux process resource usage investigation should move from system-wide metrics to individual processes. Start with uptime, free, vmstat, iostat, and sar to determine which resource is under pressure.
After identifying the affected resource, use top, ps, pidstat, iotop, ss, nethogs, or iftop to find the process or connection responsible for the activity.
Avoid making decisions from a single command output. Collect several samples and compare them with the time when users or monitoring systems reported the slowdown.
Once a process has been identified, review its service status, logs, configuration, and recent changes:
systemctl status service-namejournalctl -u service-name --since "30 minutes ago"Killing the process should normally be the last action. A controlled service restart is safer than using kill -9, which does not allow the process to close files, release locks, or complete transactions properly.
Effective Linux troubleshooting connects operating system metrics with application behavior. CPU, memory, disk, and network counters show where pressure exists, while process details and service logs explain why it exists. Following that sequence makes it possible to correct the cause instead of repeatedly treating the symptom.
External References
- Linux uptime Manual Page Reference for system uptime and load averages, including runnable processes and tasks in uninterruptible I/O states.
- Linux top Manual Page Official procps reference for interactive CPU, memory, process-state, load-average, and task monitoring.
- Linux ps Manual Page Reference for process CPU statistics, RSS, VSZ, process states, elapsed time, scheduling information, and custom process output formats.
- Linux pidstat Manual Page Reference for repeated per-process CPU, memory, page-fault, and storage I/O measurements during performance troubleshooting.
-
Linux free Manual Page
Official reference for physical memory, swap, cache,
reclaimable memory, and the MemAvailable estimate shown
by the
freecommand. - Linux vmstat Manual Page Reference for runnable and blocked processes, memory, swap activity, block I/O, CPU statistics, and interval-based virtual-memory monitoring.
- Linux iostat Manual Page Reference for storage throughput, latency, queue statistics, device utilization, and interval-based I/O performance analysis.
-
Linux Kernel Virtual Memory Documentation
Official kernel documentation covering virtual-memory
behavior, reclaim, swapping, memory controls, and the
limitations and performance impact of
drop_caches. - Linux ss Manual Page Reference for inspecting TCP and UDP sockets, connection states, owning processes, TCP metrics, retransmission timers, congestion information, and Path MTU.
- Linux nstat Manual Page Reference for inspecting Linux kernel SNMP and network protocol counters, including TCP retransmission statistics.
