

A monitoring alert saying that a Linux server has less than 10% available memory deserves investigation, but it does not automatically mean the server is in trouble.
Linux uses RAM for applications, page cache, and kernel data instead of trying to keep memory permanently free. The real question is not simply how much memory is unused, but whether the server is experiencing real memory pressure.
This is the troubleshooting sequence I use when a low-memory alert appears.
1. Confirm What Zabbix Is Actually Measuring
Before troubleshooting the operating system, check the item behind the Zabbix trigger.
These two metrics do not mean the same thing:
vm.memory.size[free]and:
vm.memory.size[pavailable]On modern Linux systems, pavailable represents available memory as a percentage of total memory and is based on MemAvailable from /proc/meminfo.
That distinction matters.
A server can have very little completely unused memory while still having reclaimable memory available to applications.
So first confirm whether the alert means:
Free memory < 10%or:
Available memory < 10%For troubleshooting memory pressure, available memory is normally the more useful metric.
2. Start with MemAvailable
Log in to the server and run:
free -hFor example:
               total        used        free      shared  buff/cache   available
Mem:            31Gi         25Gi       700Mi       500Mi       5.3Gi       3.8Gi
Swap:          8.0Gi        1.2Gi       6.8Gi
Do not look only at:
freePay attention to:
availableMemAvailable estimates how much memory can still be provided to applications without requiring swapping. It includes more context than simply counting completely unused RAM.
For additional details:
grep -E 'MemTotal|MemFree|MemAvailable|Buffers|Cached|Slab|SReclaimable|SUnreclaim|Shmem|SwapTotal|SwapFree' /proc/meminfoA low MemFree value alone is not enough to conclude that the server has a memory problem.
3. Find the Main Memory Consumers
If MemAvailable is actually low, the next question is straightforward:
Which processes are consuming the RAM?
Start with:
ps -eo pid,user,comm,%mem,rss,vsz --sort=-rss | head -20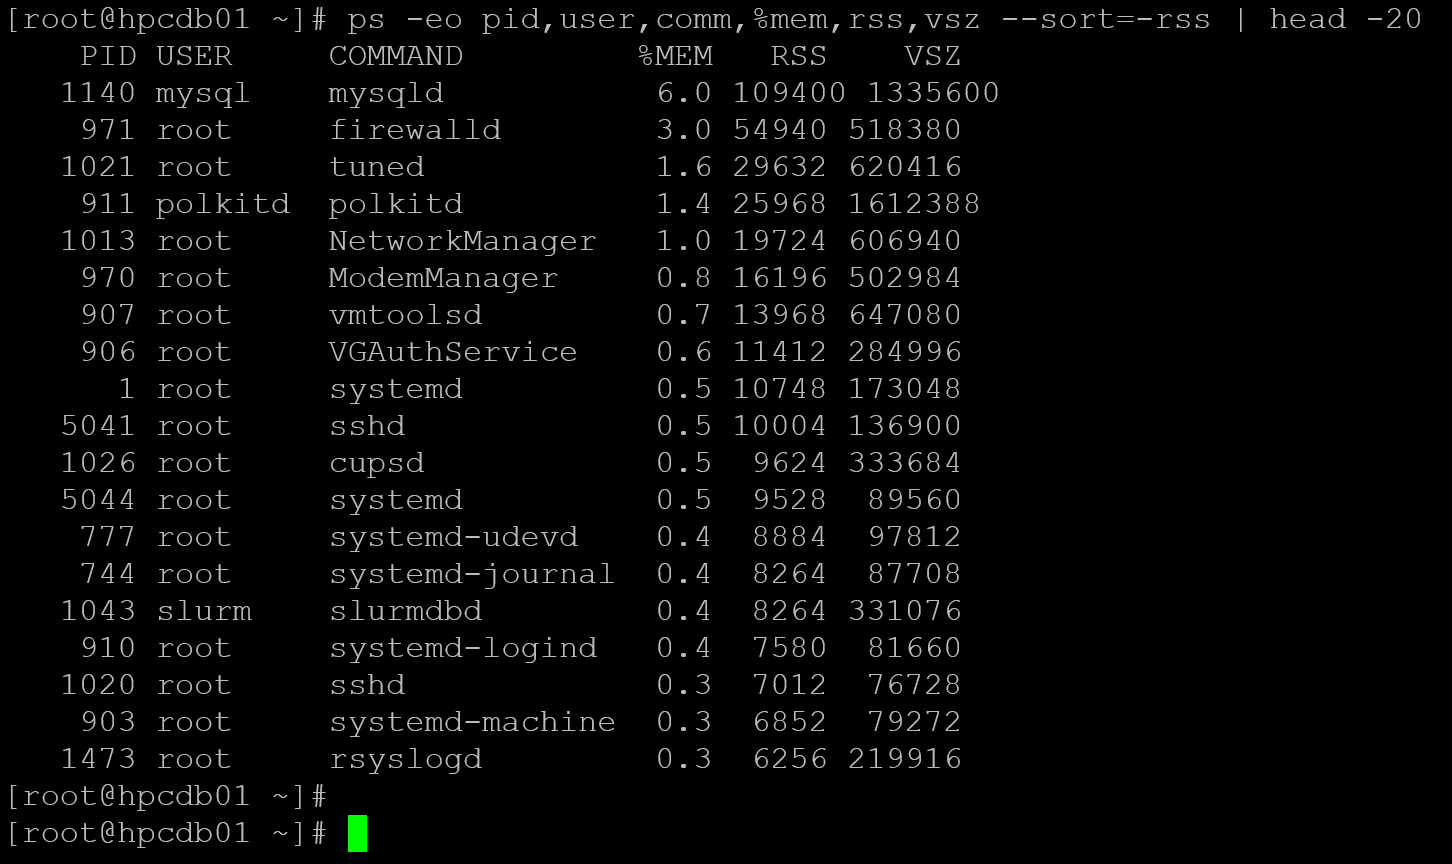
Pay particular attention to:
RSSRSS represents the portion of a process currently resident in physical memory and is useful as a first-pass indicator of large consumers.
Do not rely only on VSZ. Virtual address space can be much larger than the amount of physical RAM actually resident.
For a suspicious PID:
grep -E 'VmRSS|VmSize|VmSwap|RssAnon|RssFile|RssShmem' /proc/<PID>/statusFor a PID 1140, for example, the command is:
grep -E 'VmRSS|VmSize|VmSwap|RssAnon|RssFile|RssShmem' /proc/1140/status
If one application is consuming significantly more RAM than expected, investigate it before simply restarting or killing the process.
Also check whether its memory usage is stable or continues growing over time.
For a broader process-level investigation, see “Linux Process Resource Usage: How to Find Heavy Processes“.
4. What If No Process Explains the Memory Usage?
Sometimes ps does not reveal a process that explains most of the used memory.
Return to /proc/meminfo and inspect:
Cached
Slab
SReclaimable
SUnreclaim
Shmem
Use the following command for that:
egrep -i "Cached|Slab|SReclaimable|SUnreclaim|Shmem" /proc/meminfo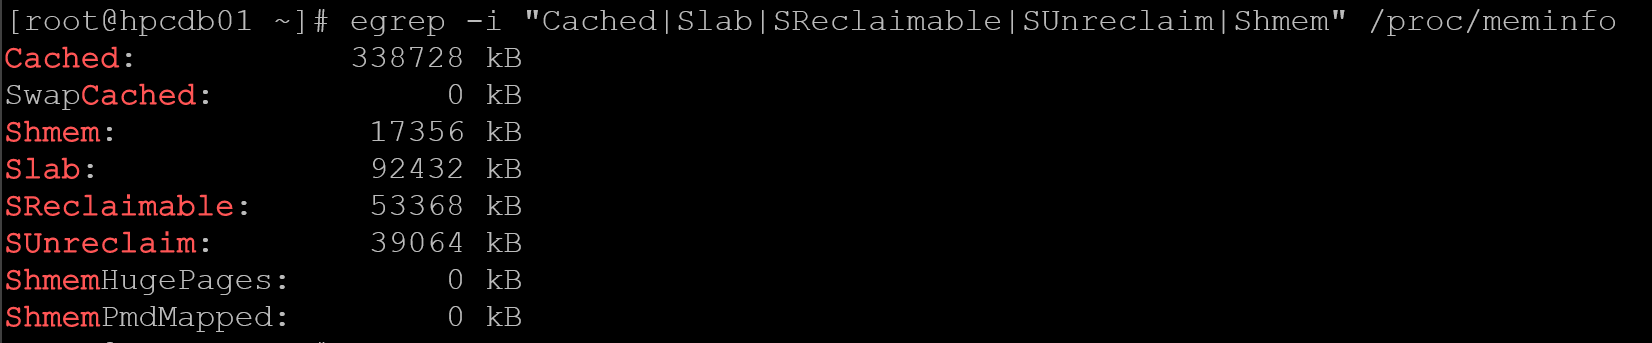
A large Cached value is not automatically a problem. Linux can use otherwise idle RAM as filesystem cache and reclaim part of it when applications require memory.
If Slab, particularly SUnreclaim, appears unusually large, check kernel slab usage:
slabtop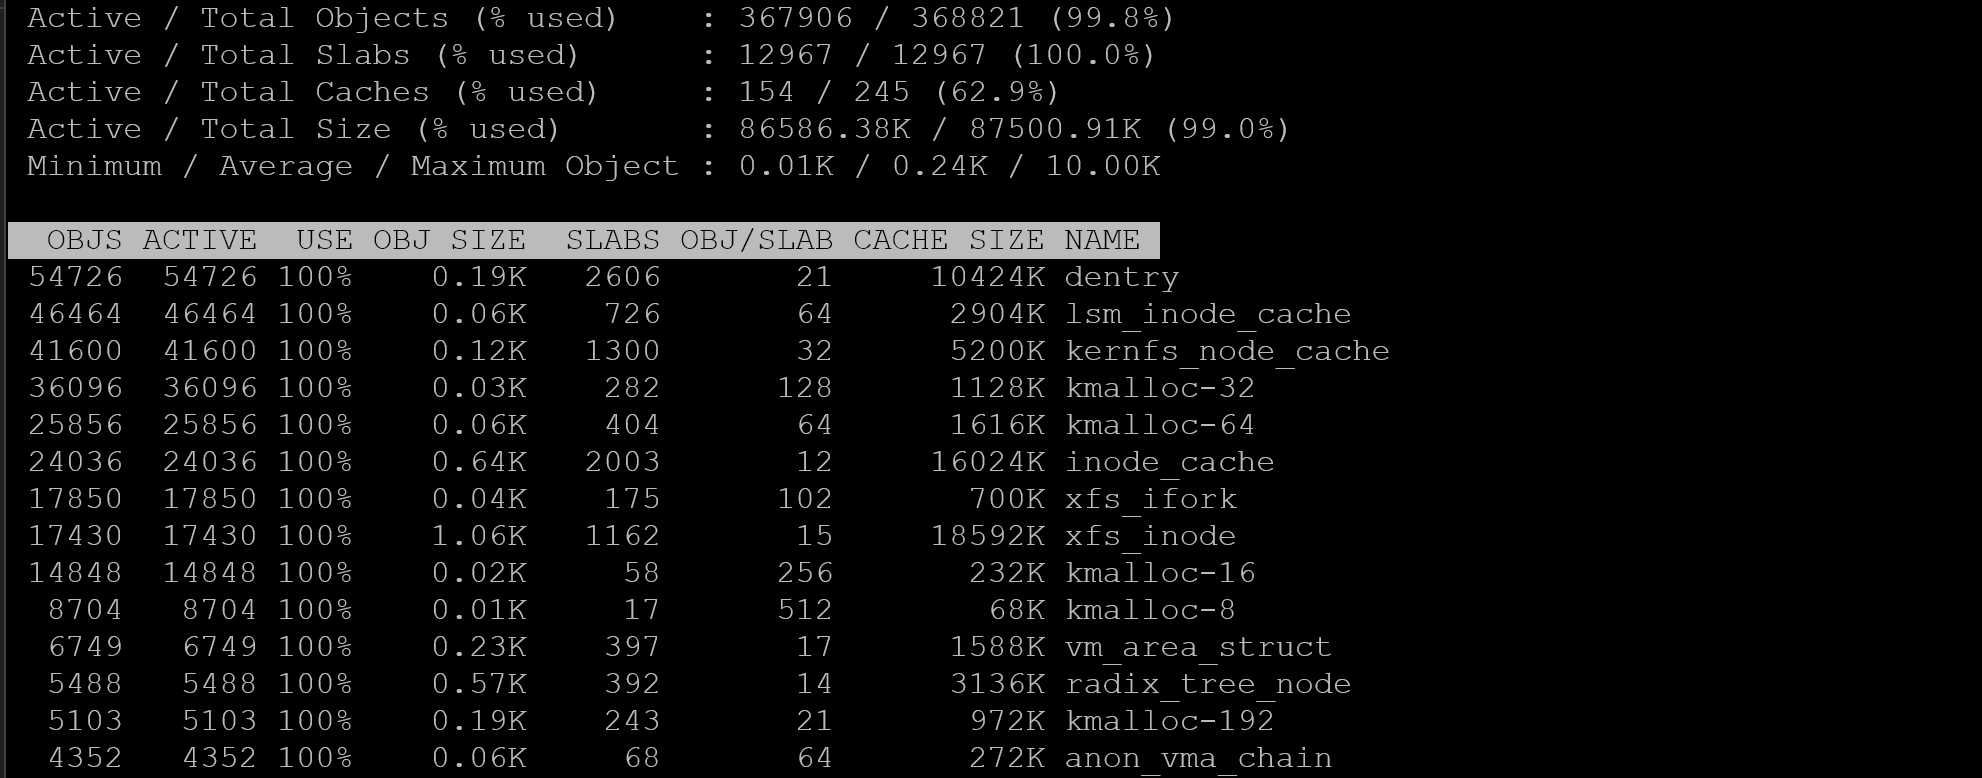
This can help determine whether the missing memory is associated with kernel data structures rather than normal application processes.
Note: Avoid clearing page cache simply to make the memory graph look better. Cache usage by itself is not evidence of a memory problem.
5. Check Whether the Server Is Actively Swapping
Seeing swap in use does not necessarily mean that the server is currently short of RAM.
Run:
vmstat 1 10Focus on:
si
so
si represents memory being read from swap.
so represents memory being written to swap.
When checking current activity, focus on the samples after the first line because the initial vmstat report contains statistics averaged since boot.
If you see:
si   so
0    0
0    0
0    0
while some swap is allocated, the pages may simply have been moved there during an earlier period of memory pressure.
That is different from repeatedly seeing activity such as:
si    so
1820  2450
930   3100
2100  1860
Low MemAvailable combined with continuous swap activity deserves further investigation.
For more detail on this specific situation, see “Linux Server Has Free Memory but Is Swapping: Why?“.
6. Check Memory Pressure with PSI (When Available)
Some Linux systems provide Pressure Stall Information (PSI), which can show whether workloads are actually being delayed because of memory contention.
First, check whether PSI is available:
ls /proc/pressure/If the directory exists and contains a memory file, run:
cat /proc/pressure/memoryA typical result looks like:
some avg10=0.00 avg60=0.02 avg300=0.01 total=...
full avg10=0.00 avg60=0.00 avg300=0.00 total=...
The some line indicates periods when at least some tasks were stalled because of memory pressure.
The full line represents periods when all non-idle tasks were stalled at the same time. Sustained values here deserve closer investigation because they indicate more severe memory contention.
However, PSI is not available or enabled on every Linux system.
For example, if you run:
cat /proc/pressure/memoryand receive:
cat: /proc/pressure/memory: No such file or directorythis does not indicate a memory problem. It only means that PSI is not currently exposed by that system’s kernel configuration.
In that case, simply skip this check and continue the investigation using free, /proc/meminfo, vmstat, process memory usage, and OOM events.
PSI is an additional diagnostic signal, not a requirement for troubleshooting high memory usage.
7. Check for OOM Events
Next, verify whether the server has already reached an out-of-memory condition:
journalctl -k | grep -Ei 'out of memory|oom|killed process'You can also check the kernel ring buffer when appropriate:
dmesg -T | grep -Ei 'out of memory|oom|killed process'If you find messages indicating that the OOM killer terminated a process, the situation is no longer just a low-memory warning. The system has already reached a point where a memory allocation could not be satisfied and corrective investigation is required.
8. Should You Act or Just Monitor?
Do not decide based only on the 10% threshold. Use the other evidence you collected:
| Finding | Interpretation |
|---|---|
Low MemFree, healthy MemAvailable | Usually normal |
Low but stable MemAvailable, no swap activity | Monitor and establish the normal baseline |
| One process RSS continuously increasing | Investigate application sizing or possible memory leak |
Low MemAvailable + continuous si/so | Active memory pressure |
Unexpectedly high SUnreclaim | Investigate kernel memory usage |
| Sustained memory PSI | Workloads are experiencing memory pressure |
| OOM events | Immediate investigation required |
The historical Zabbix graph is useful here: A server that has remained around 8% available memory for weeks, with no active swapping, no OOM events, no significant PSI, and no application impact is very different from a server where available memory is falling:
20% → 15% → 10% → 7% → 4%while swap activity and application latency increase.
The second scenario requires action.
The first may only require continued monitoring and possibly reviewing whether the trigger threshold matches the normal workload.
My Practical Troubleshooting Sequence
When I receive this alert, I normally start with:
free -hThen:
ps -eo pid,user,comm,%mem,rss,vsz --sort=-rss | head -20Check current swap activity:
vmstat 1 10Inspect where the memory is going:
grep -E 'MemAvailable|Cached|Slab|SReclaimable|SUnreclaim|Shmem|Swap' /proc/meminfoCheck memory pressure when PSI is available:
cat /proc/pressure/memoryFinally, look for OOM events:
journalctl -k | grep -Ei 'out of memory|oom|killed process'Not every low-memory alert requires corrective action. If the workload is healthy and there is no evidence of memory pressure, continue monitoring the trend.
If available memory keeps falling, active swapping appears, a process grows continuously, PSI indicates sustained pressure, or OOM events occur, investigate the responsible workload before deciding whether the solution is application tuning, restarting a service, correcting a memory leak, changing workload sizing, or adding RAM.
The objective is not simply to make the Zabbix graph green. The objective is to determine whether Linux is under real memory pressure and identify what is causing it.
External References
- Zabbix — vm.memory.size Parameters Official Zabbix documentation explaining free, available, pavailable, cached, slab, and other memory metrics available through the Zabbix agent.
- Linux Kernel — The /proc Filesystem Official Linux kernel documentation describing /proc/meminfo fields such as MemFree, MemAvailable, Cached, Slab, and other memory statistics.
- Linux Kernel — Pressure Stall Information Official Linux kernel documentation explaining PSI, the /proc/pressure interface, and the meaning of some and full resource-pressure metrics.
- Linux Manual Pages — vmstat Reference documentation for vmstat, including memory, paging, and the si and so fields used to identify current swap activity.
- Red Hat — Monitoring and Diagnosing Memory Issues in RHEL 8 Official Red Hat documentation covering tools such as vmstat for monitoring memory usage, paging activity, and diagnosing memory-related performance problems.
