

Troubleshoot packet drops on ESXi by first identifying where packet loss occurs in the virtual and physical network path. A problem that appears to involve a physical NIC may actually be caused by a virtual switch, VMXNET3 queue, CPU contention, VLAN configuration, MTU mismatch, or an upstream physical switch.
The first goal is not to collect every possible counter. It is to identify where packets enter the host, where they should leave, and at which point the counters or captures stop matching. This prevents unnecessary changes and helps separate an ESXi problem from a guest operating system or physical network problem.
This article presents a practical workflow for investigating packet drops directly from an ESXi host. The focus is on commands available from ESXi Shell or SSH, including esxcli, esxtop, net-stats, and pktcap-uw, with emphasis on understanding what the counters actually mean.
Start by Defining the Scope
Before logging in to the host, we should determine exactly what is affected:
- Is only one VM losing packets?
- Are several VMs on the same port group affected?
- Is the management interface also experiencing loss?
- Does the issue persist on the VM after a vMotion, or does it remain associated with the same host?
If one VM experiences loss while other VMs on the same host and VLAN work normally, start with the VM, its virtual NIC, and virtual switch port. If several VMs fail only on one ESXi host, the physical uplink, host networking stack, driver, or upstream switch becomes more suspicious.
When operational conditions allow it, migrate an affected VM to another healthy host. If packet loss disappears, the original host or its network path deserves closer inspection.
The first objective is to narrow the failure domain before making any changes to the ESXi host or physical network.
If the issue progresses to complete loss of ESXi management connectivity, see “Recover ESXi Host Network“.
Check the Physical NIC Status
We can access the ESXi host by SSH or Console, and start with the following command:
esxcli network nic list
This shows the vmnic name, link status, speed, duplex mode, driver, and adapter description.
We need to confirm that the expected uplinks are “Up” and running at the expected speed. Then inspect the suspected adapter. In this example, assume that the affected traffic is using vmnic0:
esxcli network nic stats get -n vmnic0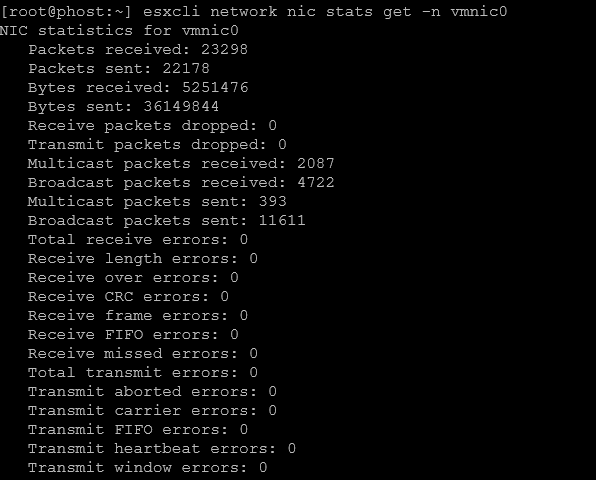
Pay attention to:
- Receive packets dropped;
- Transmit packets dropped;
- Receive errors;
- Transmit errors;
- Receive length errors;
- Receive CRC errors.
To see these specific conditions, we can filter for “dropped” and “errors”:
esxcli network nic stats get -n vmnic0 | egrep -i "dropped|errors"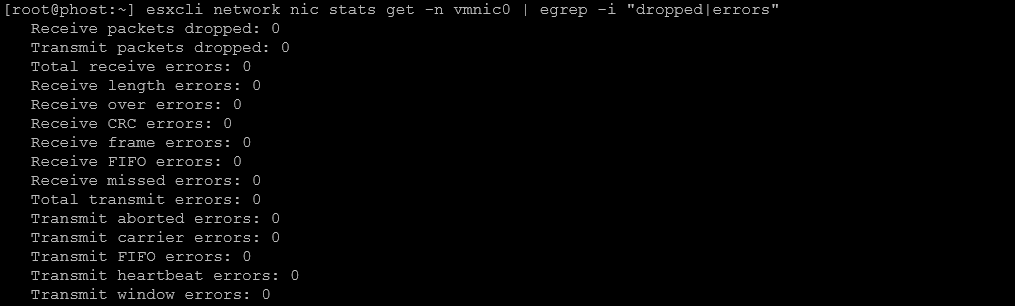
A nonzero counter alone does not prove an active issue. Run the command repeatedly while reproducing the problem and check whether the value is increasing.
Important: Broadcom notes that physical NIC receive-drop counters may represent packets discarded before reaching the ESXi kernel, while private driver statistics can provide more detail about the affected RX queue.
Use esxtop to Find Active Drops
On the ESXi command line, run:
esxtopPress:
nto open the network view. For example:
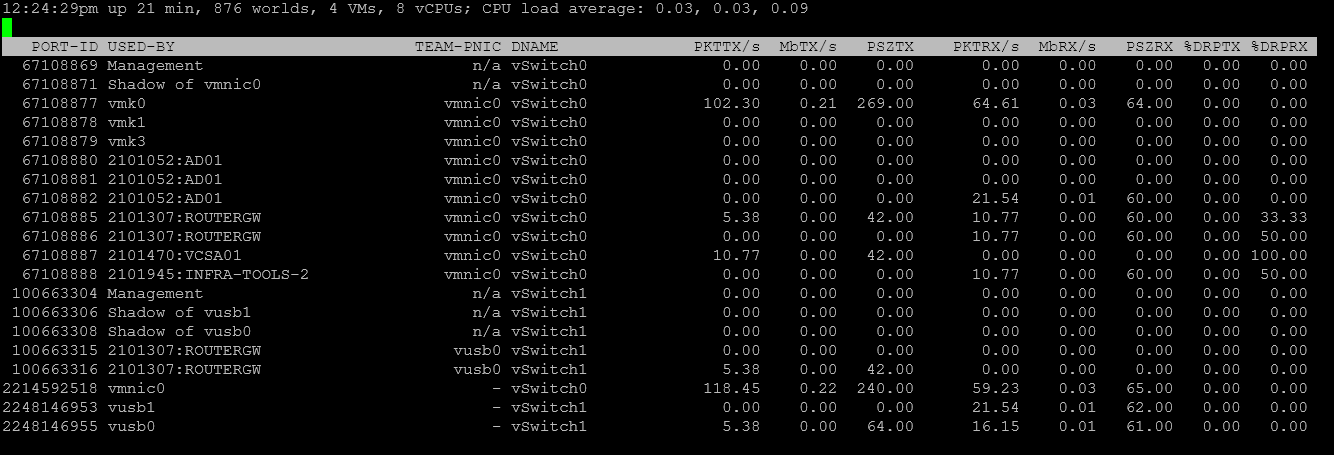
This screen shows statistics for VMs, VMkernel interfaces, physical NICs, and virtual switch ports. Two especially useful fields are:
%DRPRX
%DRPTX
They represent dropped receive and transmit traffic for the displayed network object, respectively.
A rising %DRPRX value indicates that receive packets are being dropped close to the VM or virtual-switch path, but the counter alone does not identify the root cause. Correlate it with guest CPU availability, VMXNET3 receive queues, buffer exhaustion, and packet captures before making configuration changes:
- The VM named “ROUTERGW” is experiencing dropped packets at the receive counter;
- In this case, after a deep investigation, this VM (and all other VMs with the same behavior) has received dropped packets because it was not allowed to access the Internet. After fixing it, the count of dropped packets did not increase anymore.
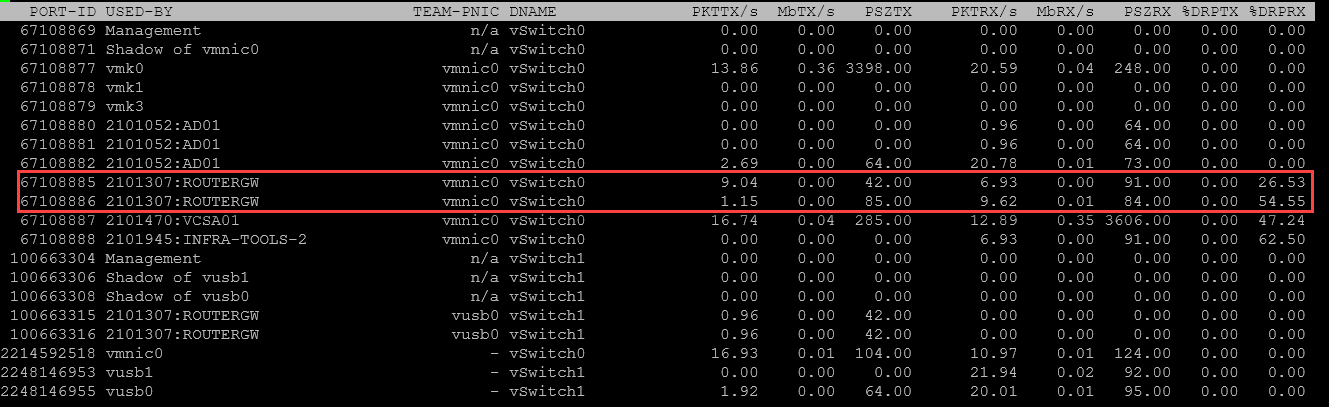
Broadcom documents that receive drops at the virtual switch can occur when a guest cannot process incoming traffic quickly enough because of insufficient receive buffering or CPU availability.
Keep esxtop running while generating the traffic that normally exposes the problem. A single snapshot may miss short bursts.
Check CPU Contention
Networking on ESXi still depends on CPU time. A host can have healthy physical interfaces and still lose packets if the system or an affected VM cannot process traffic quickly enough.
In esxtop, press:
cto view CPU statistics. For affected VMs, inspect %RDY and %USED. A sustained increase in %RDY indicates that the VM is ready to run but cannot obtain physical CPU time, while %USED shows how much CPU the VM is actually consuming. Compare these values with periods when network-drop counters increase.
For example:
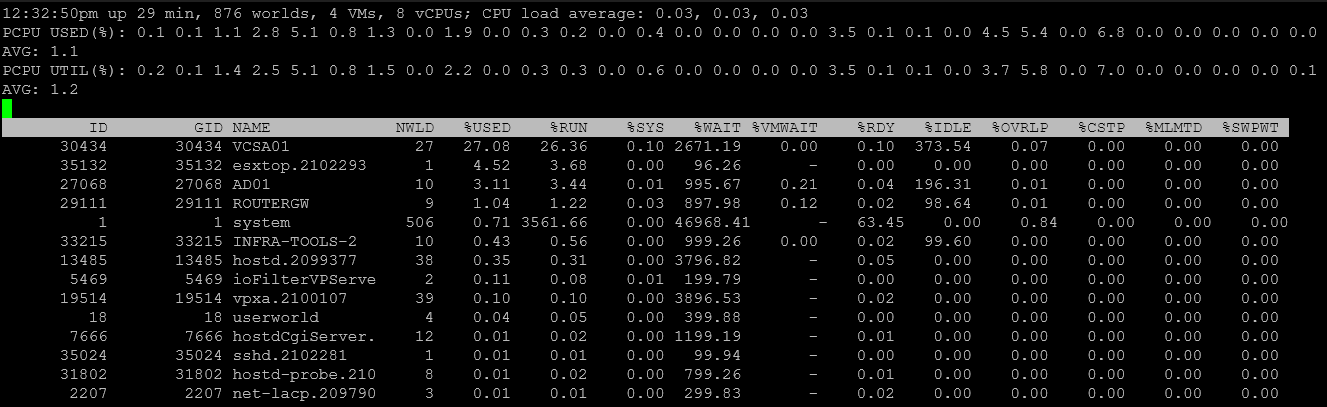
Pay particular attention to %RDY. A high CPU utilization value does not automatically mean the VM is experiencing CPU contention. However, if %RDY remains elevated, the VM may be spending too much time waiting for access to physical CPU resources.
This can affect network processing because the guest may not receive enough CPU time to handle incoming packets as quickly as they arrive. Under sustained load, that delay can contribute to receive-queue pressure and packet drops.
Note: This behavior is more likely to appear during periods of heavy activity, such as backup operations, sudden traffic bursts, or other workloads that significantly increase CPU demand.
Investigate RX Ring and Driver-Level Drops
First and foremost: What is the RX ring?
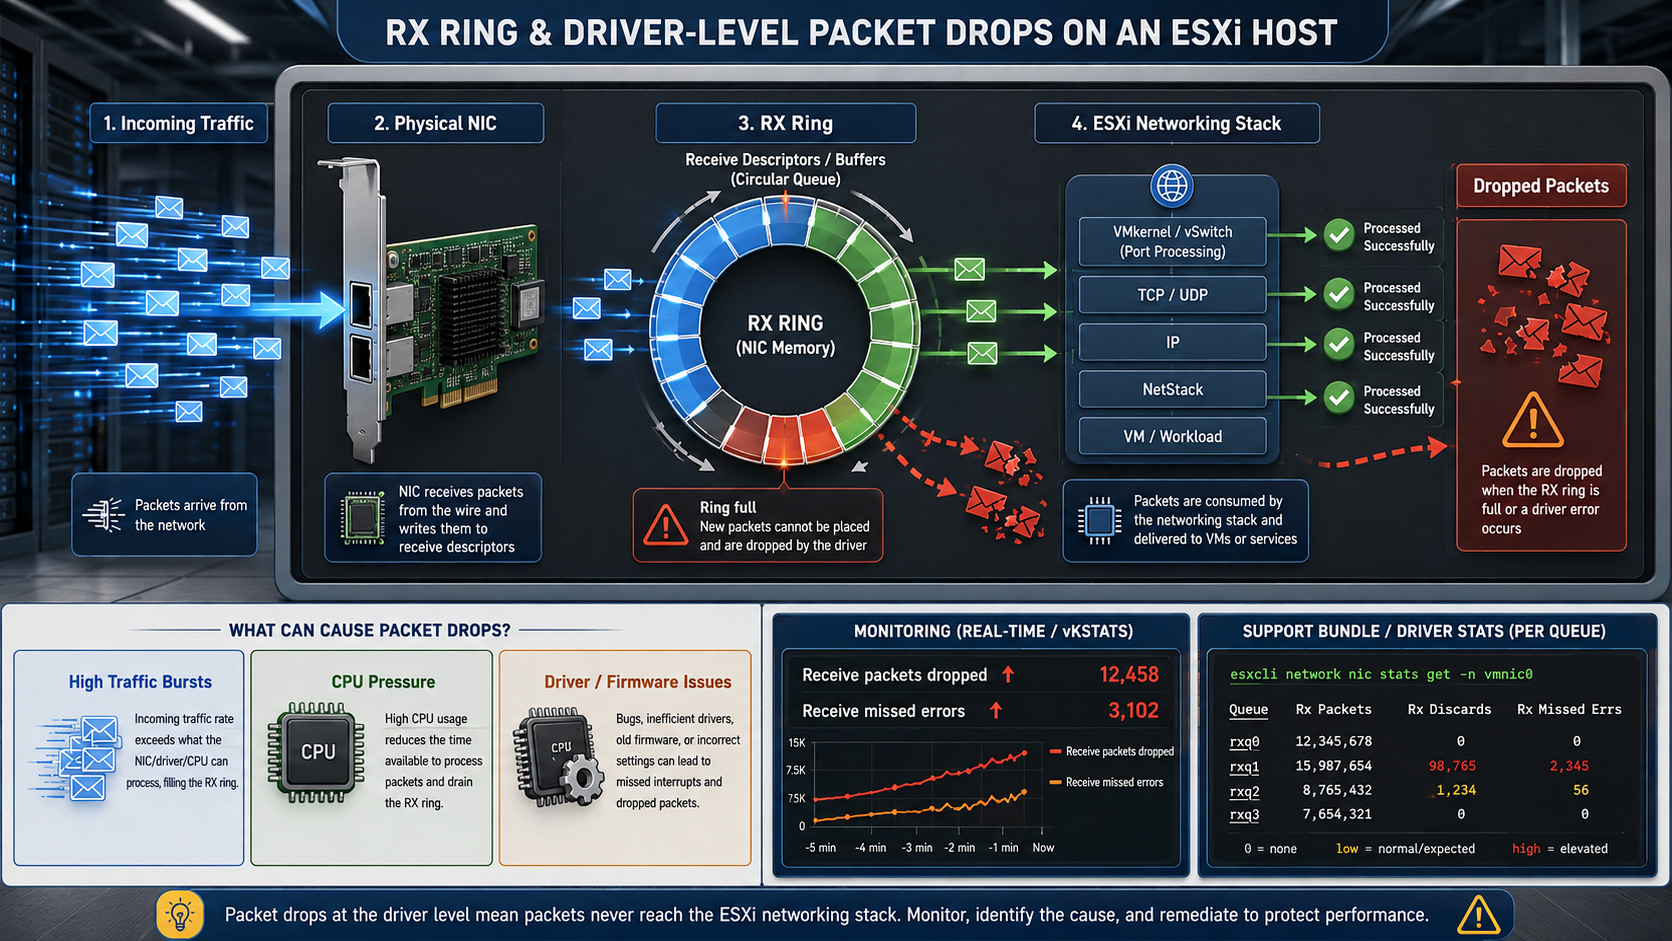
The RX ring is a circular queue of receive descriptors used by the physical NIC to temporarily hold information about incoming packets before ESXi processes them. Each descriptor points to a memory buffer where a received packet can be placed. As ESXi processes packets, those descriptors are freed and reused, allowing the NIC to continuously receive new traffic. In simple terms, the RX ring works as a temporary buffering mechanism between the physical adapter and the ESXi networking stack.
High incoming traffic can exhaust the RX ring of a physical NIC. If packets arrive faster than ESXi can process them and return descriptors to the ring, the available receive buffers can eventually be 100% consumed. When that happens, newly arriving frames may be discarded before they are passed further into the ESXi networking stack.
To determine whether receive-side drops are actively increasing, start by checking the physical NIC statistics:
esxcli network nic stats get -n vmnic0Pay particular attention to counters such as:
Receive packets dropped
Receive missed errors
Receive FIFO errors
We can filter the output to focus on drop and error counters:
esxcli network nic stats get -n vmnic0 | egrep -i \
"Receive packets dropped|Receive missed errors|Receive FIFO errors"
The exact counters available depend on the physical NIC and its driver, so not every adapter exposes the same fields.
A single high value does not necessarily indicate an active problem because the counter may have accumulated over a long period. The important point is to determine whether it continues to increase while the packet-loss issue is occurring.
We can monitor the statistics repeatedly with:
watch esxcli network nic stats get -n vmnic0For example, the first check may show:
Receive packets dropped: 12540
Receive missed errors:   12540
A few seconds later:
Receive packets dropped: 13280
Receive missed errors:   13280
If these counters continue to rise while you reproduce the issue, receive-side packet loss is actively occurring on that adapter.
Broadcom documents receive missed errors and RX queue discards as indicators that packets may be arriving faster than the NIC or ESXi networking stack can process them. However, there is not always a counter explicitly named RX ring exhausted. The actual counter names vary depending on the NIC vendor and driver.
Standard esxcli statistics can show that drops are occurring, but they may not reveal which hardware RX queue is responsible. For deeper investigation, driver-specific private statistics are usually collected in an ESXi support bundle.
Generate the bundle with:
vm-supportInside the extracted support bundle, inspect the NIC-related information, commonly found in files such as:
commands/nicinfo.sh.txtDepending on the adapter and driver, you may find RX queue counters similar to:
[rxq0] discards rx: 0
[rxq1] discards rx: 11585755
[rxq2] discards rx: 6619
These counters can help determine whether one particular receive queue is responsible for most of the drops. In some cases, the accumulated RX queue discard values closely correspond to the Receive packets dropped counter reported by esxcli.
A useful troubleshooting sequence is therefore:
esxcli network nic stats get
        ↓
Are receive-drop counters increasing?
        ↓
       Yes
        ↓
Check missed errors and driver statistics
        ↓
Identify whether specific RX queues are dropping packets
        ↓
Investigate CPU pressure, traffic bursts,
driver/firmware compatibility, and the physical path
        ↓
If necessary, generate the vm-support log bundle and engage Broadcom if you have active support with them.
Important: Do not increase RX ring or buffer settings only because receive drops are visible. Queue exhaustion may be a symptom of CPU pressure, traffic bursts, driver or firmware issues, or problems elsewhere in the physical network. Change ring parameters only after identifying the actual bottleneck or when instructed by Broadcom or the NIC vendor.
Verify the VM and Its Virtual NIC
If the problem is isolated to one VM, map it to its switch port:
net-stats -l | grep -i "vm-name"Example:

The switch port becomes useful for targeted packet captures.
For VMXNET3 network adapters, buffer exhaustion is also possible under heavy or bursty traffic. Broadcom documents packet loss associated with insufficient receive or transmit buffer space and vNIC buffer exhaustion.
Check counters inside the guest as well. On Linux:
ip -s link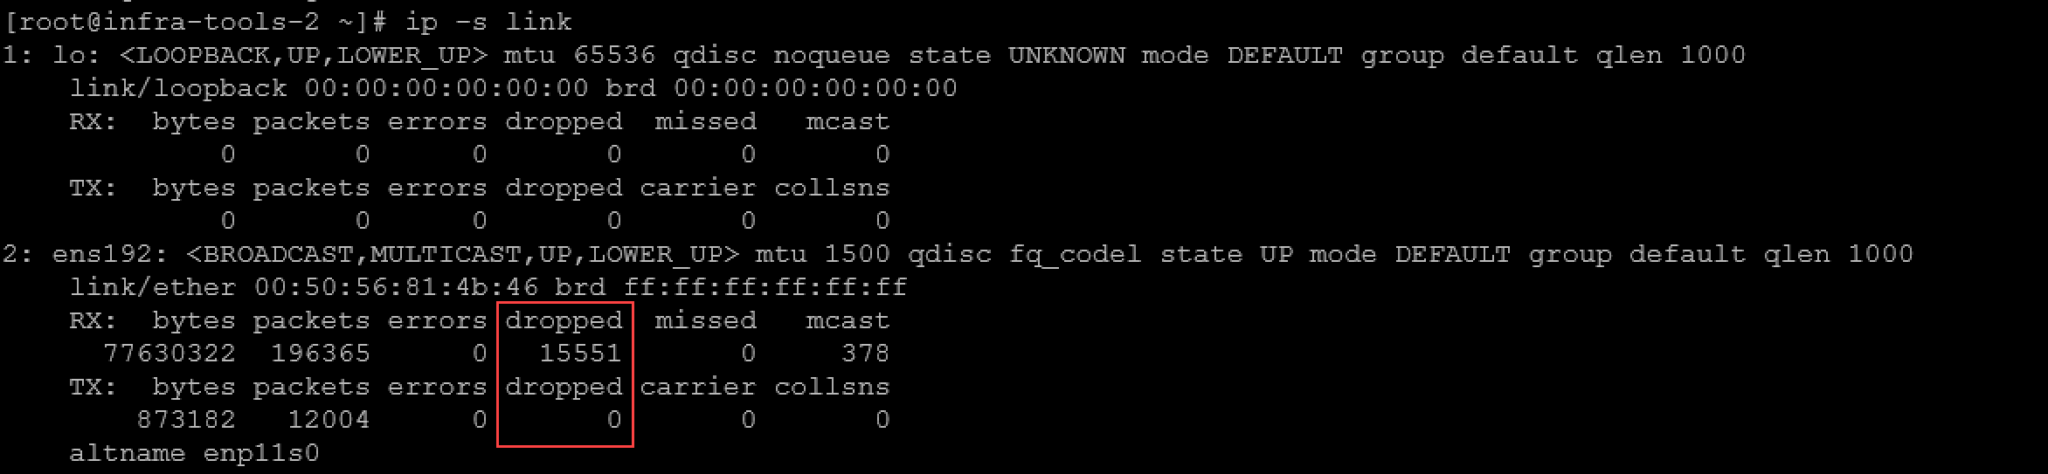
For Windows guests, start by checking the virtual NIC statistics with PowerShell:
Get-NetAdapterStatisticsThis command shows statistics such as received and transmitted packets, discards, and errors for each network adapter. Microsoft documents Get-NetAdapterStatistics as the standard PowerShell cmdlet for retrieving adapter-level broadcast, multicast, discard, and error counters.
If the VM has multiple adapters, first identify the VMXNET3 interface:
Get-NetAdapterThen query only that adapter:
Get-NetAdapterStatistics -Name "Ethernet"The objective is to determine whether ESXi delivered the packet but the guest failed to process it.
Trace the Packet Through the ESXi Datapath
When counters are not enough to identify the root cause, pktcap-uw becomes especially useful because it allows us to observe the same packet at different points inside the ESXi datapath.
Important: pktcap-uw is a troubleshooting tool and should not be left running for long periods on busy hosts. Use filters whenever possible, keep captures short, and stop all capture processes after collecting the required evidence.
The important idea is not simply to capture traffic. The goal is to determine:
- At which point does the packet disappear?
For a VM communicating with an external system (a physical server, for example), a simplified path looks like this:
Guest OS
   ↓
VM virtual NIC
   ↓
vSwitch / Distributed Switch
   ↓
Physical uplink (vmnic)
   ↓
Physical network
Broadcom documents separate capture points for the VM-facing side and the physical uplink, allowing both sides of the ESXi datapath to be compared.
First, we should identify the VM switchport (in simple words, what’s the port ID in the virtual switch used by the virtual machine):
net-stats -l | grep -i "<VM-name>"The following command can be used to list all running virtual machines on the ESXi host:
esxcli vm process listSo, get the VM switchport. For example:
net-stats -l | grep -i "INFRA-TOOLS-2"
Note: In this case, for instance, the VM switchport ID is “67108888”.
We can also confirm which physical uplink is carrying the VM traffic by running:
esxtopand pressing:
n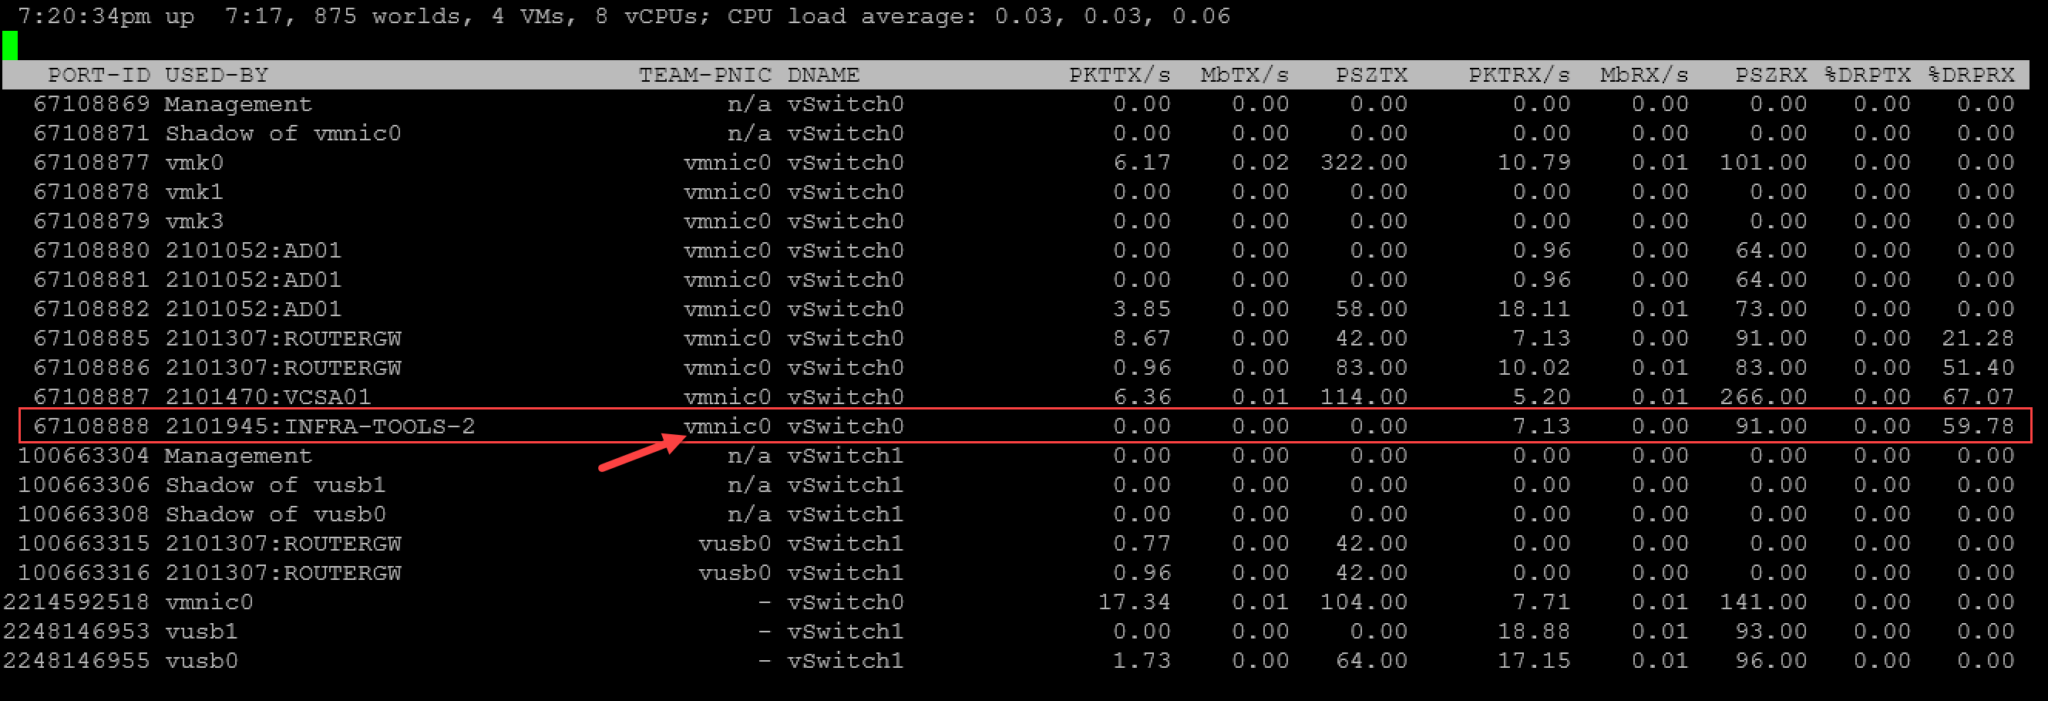
The PORT-ID identifies the VM switchport, while TEAM-PNIC shows the physical uplink being used by the ESXi host to carry the traffic. Broadcom documents this mapping as one method for determining the correct capture points.
So, at this point, we have:
- VM switchport ID (Port-ID): 67108888;
- Host’s physical NIC: vmnic0.
Capture Traffic at the VM Side
Access the ESXi command line to capture packets entering and leaving the VM virtual NIC (replace 67108888 with your VM switchport ID):
pktcap-uw --switchport 67108888 \
--capture VnicTx,VnicRx \
-o - | tcpdump-uw -r - -nne
The two capture points are important:
VnicTx = packet transmitted from the guest to ESXi (Guest VM --> ESXi host)
VnicRx = packet delivered by ESXi to the guest (ESXi host --> Guest VM)
Broadcom defines VnicTx as traffic transmitted from the guest and VnicRx as traffic received by the guest-side vNIC backend.
Now capture the same traffic at the physical NIC:
pktcap-uw --uplink vmnic0 \
--capture UplinkSndKernel,UplinkRcvKernel \
-o - | tcpdump-uw -r - -nne
Here:
UplinkSndKernel = ESXi sends the packet toward the physical NIC
UplinkRcvKernel = ESXi receives the packet from the physical NIC
These capture points represent the boundary between the ESXi networking stack and the physical network.
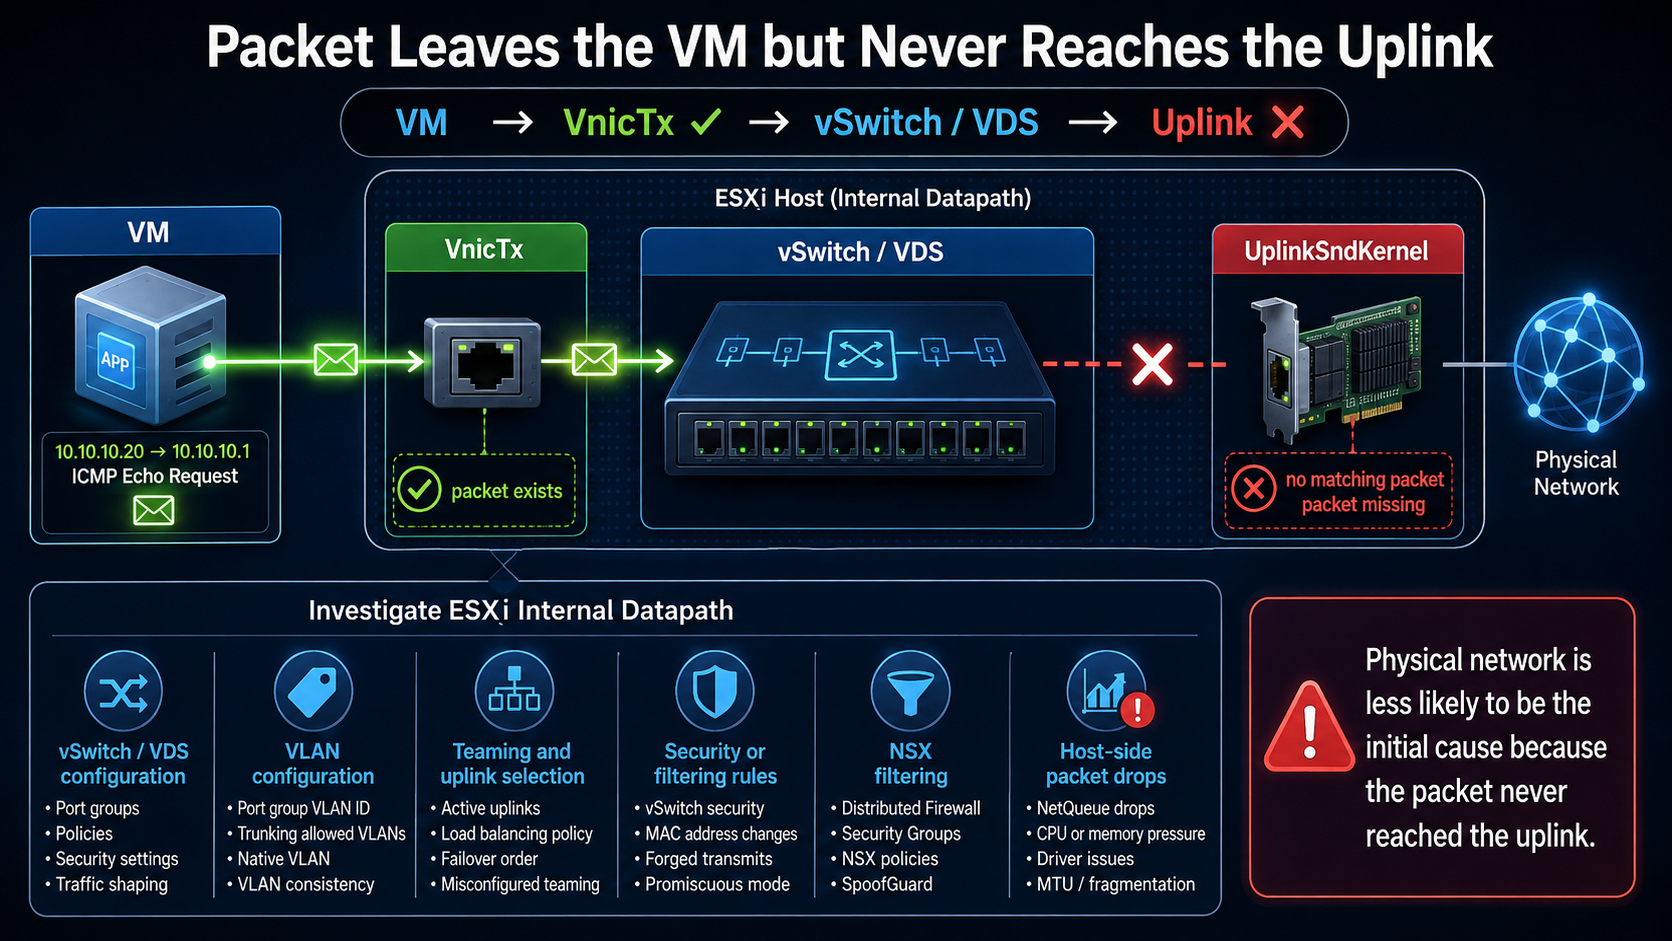
Example 1: Packet Leaves the VM but Never Reaches the Uplink
Suppose the VM sends:
10.10.10.20 → 10.10.10.1 ICMP Echo RequestAt the VM switchport you see:
VnicTx
10.10.10.20 > 10.10.10.1: ICMP echo request
But on the physical uplink:
UplinkSndKernel
<no matching packet>
This tells you something very useful:
VM
 ↓
VnicTx     ✓ packet exists
 ↓
vSwitch
 ↓
Uplink     ✗ packet missing
The packet entered ESXi from the VM but disappeared before it was transmitted through the physical NIC.
At this point, investigate the ESXi internal datapath, including:
- vSwitch or VDS configuration;
- VLAN configuration;
- teaming and uplink selection;
- security or filtering rules;
- NSX filtering, if applicable;
- host-side packet drops.
Important: In this example, the physical network is less likely to be the initial cause because the packet never reached the uplink.
Example 2: Packet Leaves the ESXi Host but No Reply Returns
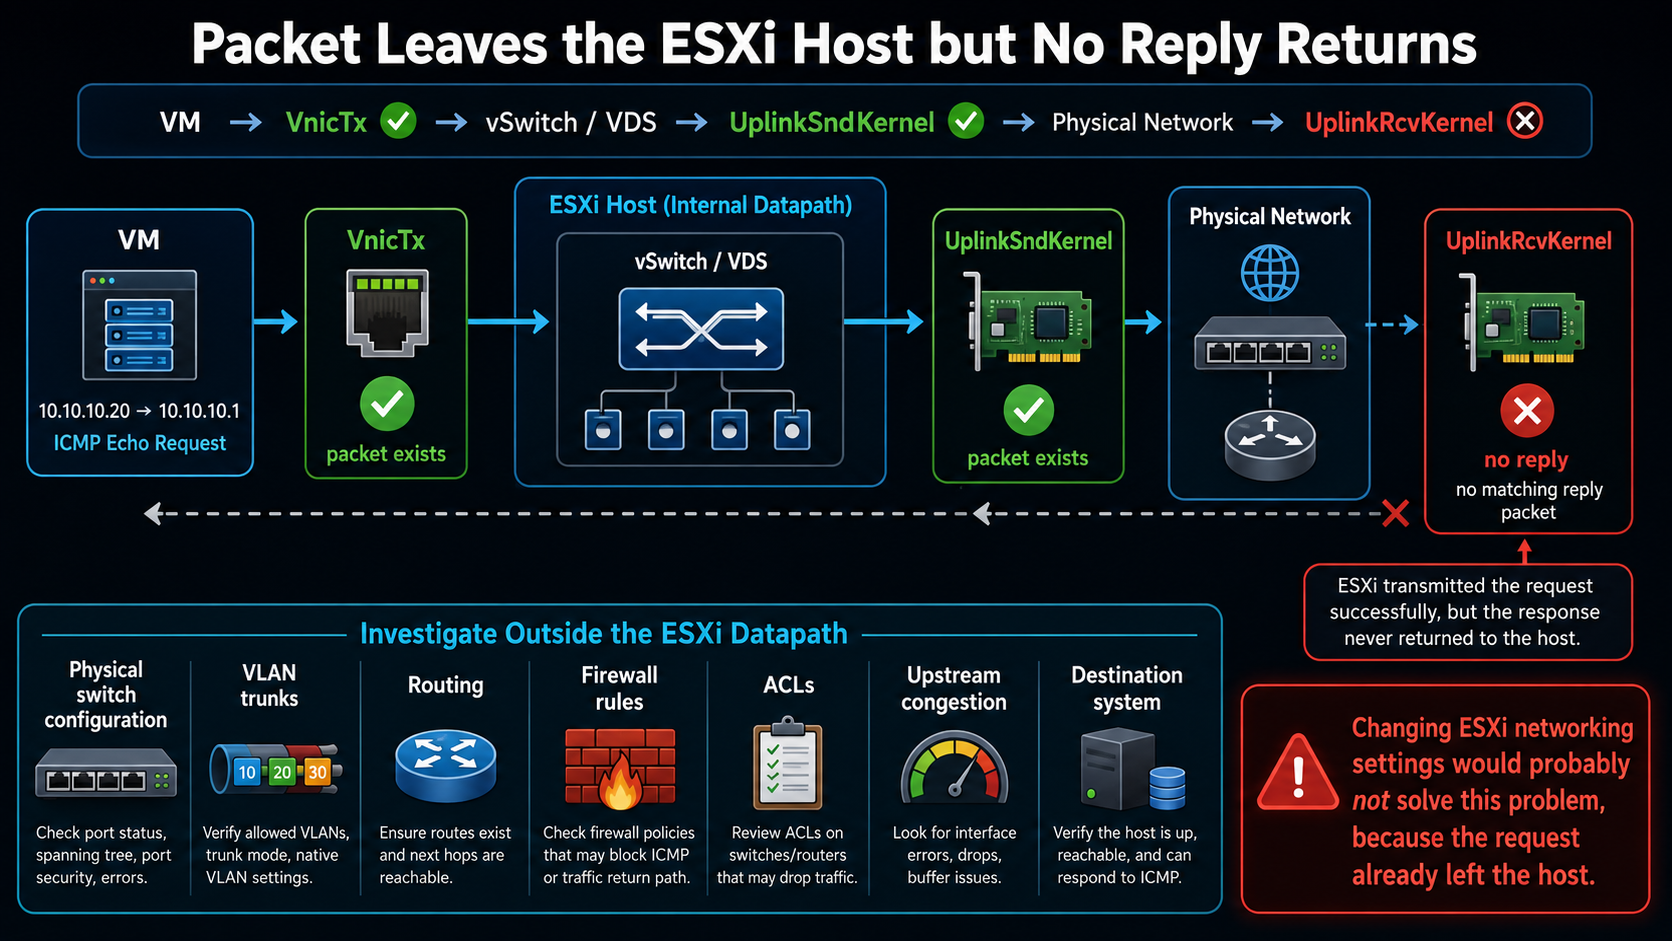
Now suppose you see the request at both points:
VnicTx:
10.10.10.20 > 10.10.10.1: ICMP echo request
and:
UplinkSndKernel:
10.10.10.20 > 10.10.10.1: ICMP echo request
However, you never see the corresponding reply in:
UplinkRcvKernelThe path now looks like:
VM
 ↓
VnicTx             ✓
 ↓
vSwitch
 ↓
UplinkSndKernel    ✓
 ↓
Physical network
 ↓
UplinkRcvKernel    ✗ no reply
ESXi successfully transmitted the request, but the response never returned to the host.
The investigation should now move outside the ESXi datapath. Check:
- physical switch configuration;
- VLAN trunks;
- routing;
- firewall rules;
- ACLs;
- upstream congestion;
- destination system.
This distinction is extremely important because changing ESXi networking configuration would probably not solve the problem.
Example 3: Reply Reaches the Physical NIC but Never Reaches the VM
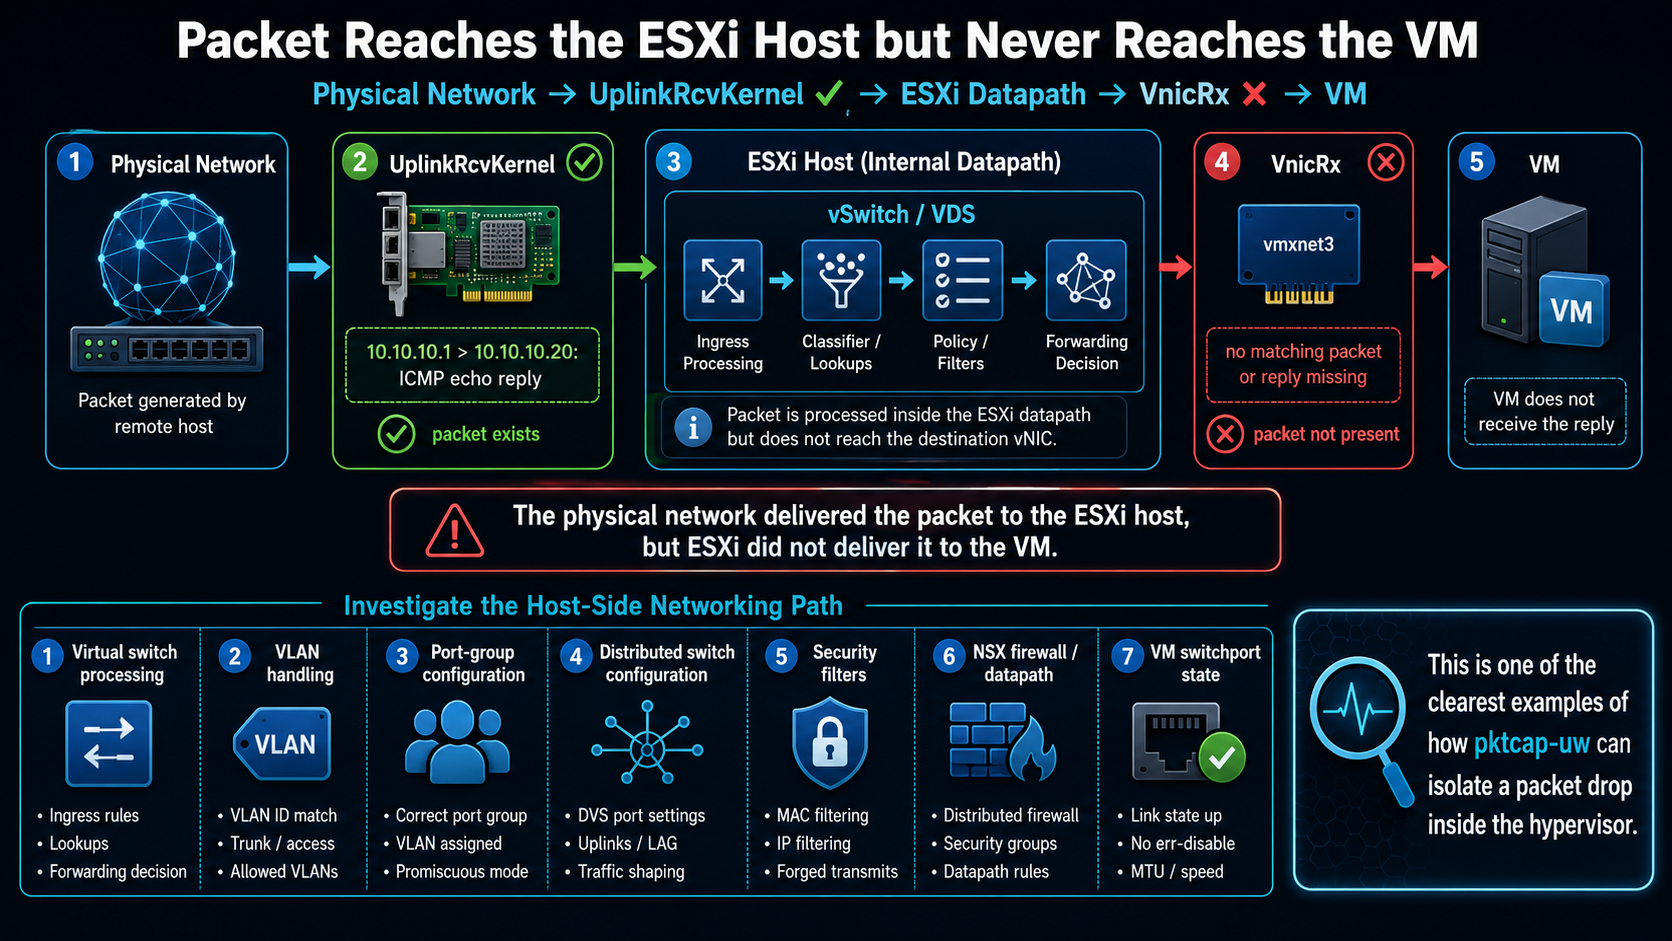
A different situation occurs when you see:
UplinkRcvKernel:
10.10.10.1 > 10.10.10.20: ICMP echo reply
but no corresponding packet appears at:
VnicRxThe flow becomes:
Physical network
      ↓
UplinkRcvKernel    ✓
      ↓
ESXi datapath
      ↓
VnicRx             ✗
      ↓
VM
This proves that the physical network delivered the packet to the ESXi host, but ESXi did not deliver it to the VM.
Focus the investigation on the host-side networking path, including:
- virtual switch processing;
- VLAN handling;
- port-group configuration;
- distributed switch configuration;
- security filters;
- NSX firewall or datapath components;
- VM switchport state.
This is one of the clearest examples of how pktcap-uw can isolate a packet drop inside the hypervisor.
Example 4: ESXi Delivers the Packet but the Guest Still Reports Loss
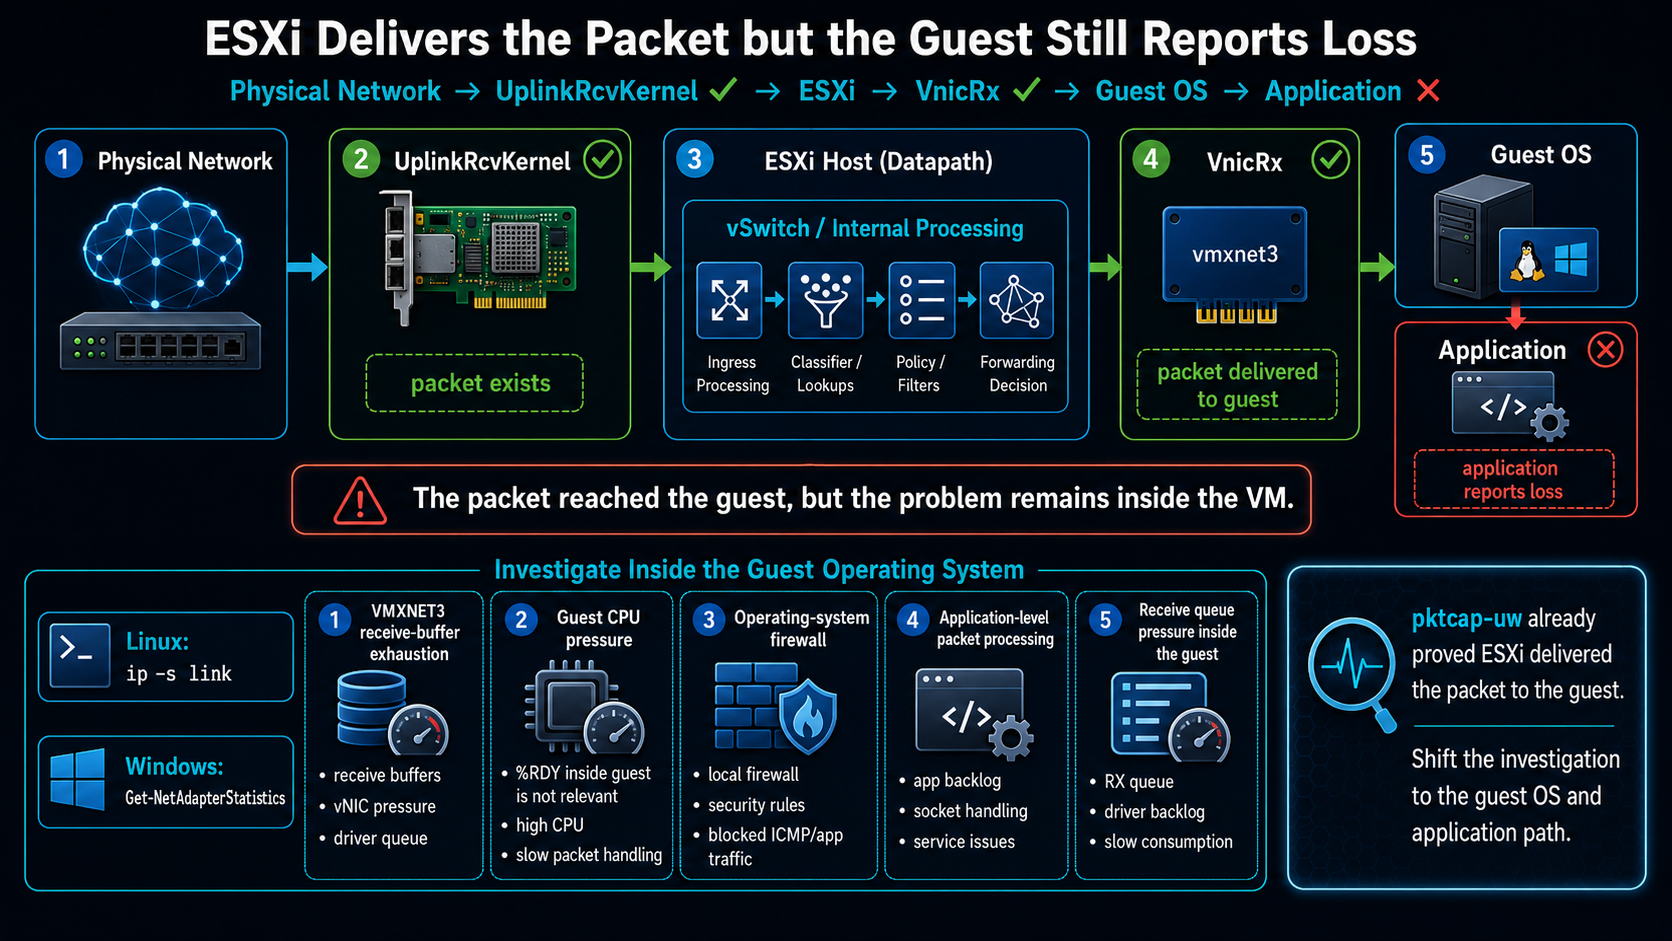
Suppose the reply appears at both:
UplinkRcvKernel     ✓
VnicRx              ✓
but the application inside the VM still reports packet loss.
Now ESXi has done its job:
Physical network
      ↓
UplinkRcvKernel    ✓
      ↓
ESXi
      ↓
VnicRx             ✓
      ↓
Guest OS
      ↓
Application        ✗
At this point, investigate the guest operating system instead.
For Linux:
ip -s linkFor Windows:
Get-NetAdapterStatisticsPossible causes include:
- VMXNET3 receive-buffer exhaustion;
- guest CPU pressure;
- operating-system firewall;
- application-level packet processing;
- receive queue pressure inside the guest.
Capture Both Points at the Same Time
Whenever possible, capture the VM switchport and the uplink simultaneously. Broadcom explicitly recommends simultaneous capture because comparing packets from the same time window makes it easier to identify where traffic disappears.
For example:
pktcap-uw --switchport <port-id> \
--capture VnicTx,VnicRx \
-o /tmp/vm-port.pcap &

pktcap-uw --uplink vmnic0 \
--capture UplinkSndKernel,UplinkRcvKernel \
-o /tmp/uplink.pcap &
Reproduce the issue for a short period and then stop the captures.
The files can then be opened in Wireshark and compared using the same source IP, destination IP, protocol, sequence number, or TCP stream.
For ICMP troubleshooting, sequence numbers make the comparison particularly simple:
VM port:
ICMP seq 100 ✓
ICMP seq 101 ✓
ICMP seq 102 ✓

Uplink:
ICMP seq 100 ✓
ICMP seq 101 ✗
ICMP seq 102 ✓
If sequence 101 exists at the VM side but is absent from the uplink capture, you have strong evidence that the packet was lost somewhere inside the ESXi datapath.
The same principle applies in the reverse direction.
In practice, pktcap-uw is most valuable when used as a packet-path comparison tool, not simply as another packet sniffer. By observing the same flow at the VM boundary and the physical uplink, we can progressively narrow the failure domain until you know whether the loss occurs inside the guest, inside ESXi, or outside the host.
Note: For a specific example of packet capture between vCenter and ESXi, see “Debugging vCenter and ESXi Heartbeat“.
Look for Explicit Drop Reasons
pktcap-uw can also capture packets dropped by ESXi:
pktcap-uw --capture DropExample:
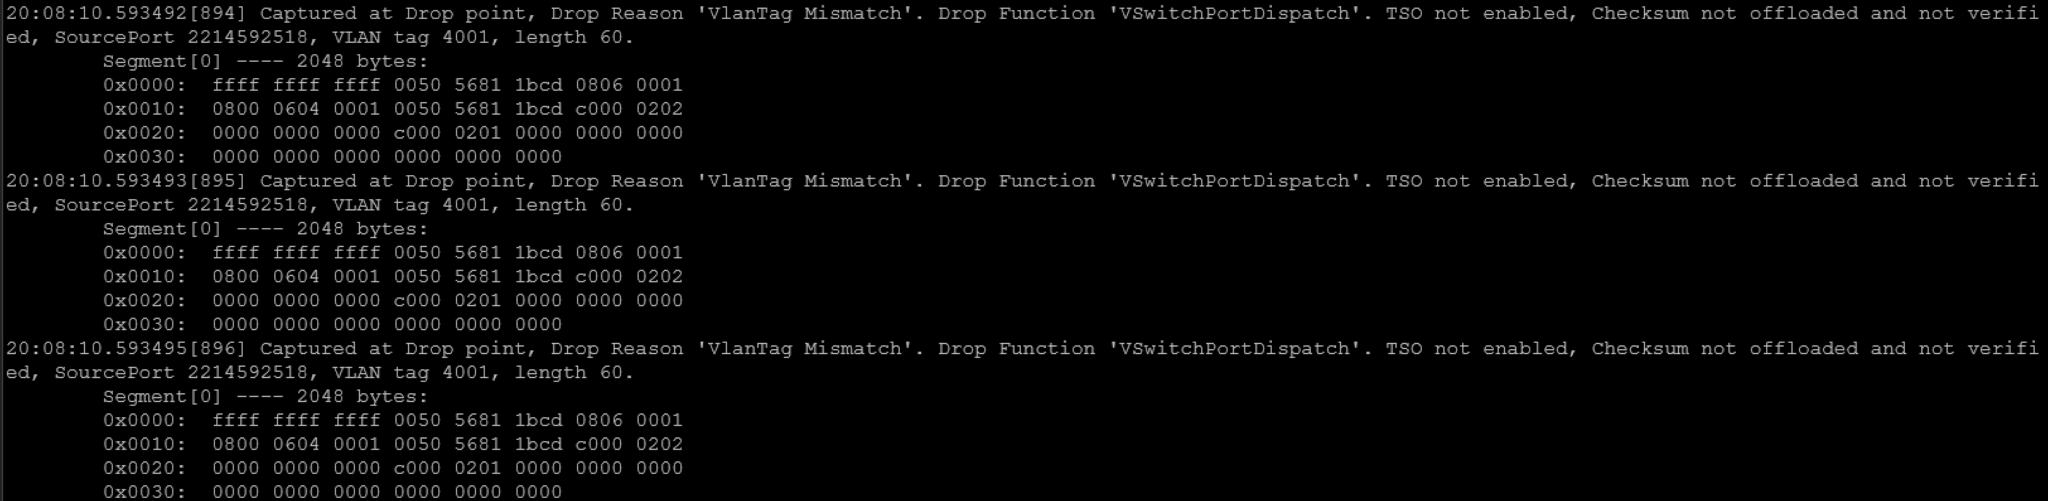
This can expose reasons that generic counters do not reveal. Broadcom documents cases where pktcap-uw identifies VLAN tag mismatches responsible for connectivity failures.
This is especially useful when packet loss affects one VLAN or one distributed port group while other traffic remains healthy.
Verify VLAN and MTU Consistency
We should check that the VLAN configured on the port group matches the physical switch configuration and that the VLAN is allowed across every required uplink or trunk.
MTU should also be validated end-to-end. For VMkernel traffic, first confirm basic connectivity:
vmkping -I vmk1 <destination-ip>If the network is configured with an MTU of 9000, test Jumbo Frames by sending an 8972-byte ICMP payload with fragmentation disabled:
vmkping -I vmk1 -d -s 8972 <destination-ip>For example:
vmkping -I vmk1 -d -s 8972 10.10.20.11The -d option sets the Don’t Fragment flag, while -s 8972 specifies the ICMP payload size. Broadcom recommends this method when validating an MTU of 9000.
A successful test should return replies similar to:
PING 10.10.20.11 (10.10.20.11): 8972 data bytes
8980 bytes from 10.10.20.11: icmp_seq=0 ttl=64 time=0.250 ms
8980 bytes from 10.10.20.11: icmp_seq=1 ttl=64 time=0.231 ms
8980 bytes from 10.10.20.11: icmp_seq=2 ttl=64 time=0.244 ms
If a normal ping works:
vmkping -I vmk1 10.10.20.11but the Jumbo Frame test fails:
vmkping -I vmk1 -d -s 8972 10.10.20.11the path likely contains an MTU inconsistency.
A useful troubleshooting approach is to progressively increase the packet size:
vmkping -I vmk1 -d -s 1472 <destination-ip>
vmkping -I vmk1 -d -s 4972 <destination-ip>
vmkping -I vmk1 -d -s 8972 <destination-ip>
For example:
1472 bytes    ✓
4972 bytes    ✓
8972 bytes    ✗
This strongly suggests that the path supports standard Ethernet frames and some larger packets, but not the full MTU 9000 configuration.
When the Jumbo Frame test fails, verify MTU consistently across the entire path:
VMkernel adapter
       ↓
vSwitch / Distributed Switch
       ↓
Physical NIC
       ↓
Physical switch port
       ↓
Trunks / Port Channels
       ↓
Intermediate switches
       ↓
Destination interface
Every component in the path must support the required frame size. A single interface configured with a smaller MTU can cause the large packet to be dropped. Broadcom specifically notes that ESXi VMkernel interfaces and the surrounding physical infrastructure must use consistent MTU settings for Jumbo Frames to work correctly.
Therefore, a successful standard ping does not prove that Jumbo Frames are working. Always use -d -s 8972 when validating an MTU 9000 path.
Compare Both Physical Uplinks
Teamed uplinks can hide a path-specific failure.
If the host uses vmnic0 and vmnic1, compare both:
esxcli network nic stats get -n vmnic0
esxcli network nic stats get -n vmnic1
One adapter may show increasing drops while the other remains clean.
Broadcom has documented cases where packet loss stopped after traffic no longer used one affected uplink, confirming a path-specific problem.
If production requirements allow it, testing one uplink at a time can help isolate the fault, but changes must be coordinated because they affect redundancy.
Do Not Ignore the Physical Network
A clean ESXi host does not prove that a packet reached its destination.
If pktcap-uw shows traffic leaving the correct vmnic but responses never return, give the network team concrete evidence: source and destination addresses, VLAN, timestamps, affected uplink, and captures.
Ask them to inspect physical switch errors, discards, VLAN configuration, port-channel consistency, congestion, and the path beyond the directly connected switch.
Broadcom similarly recommends moving the investigation to the physical network when captures demonstrate that the drop occurs outside the ESXi hosts.
A Practical Troubleshooting Sequence
During an active incident, this order works well:
- Confirm which VMs, VLANs, and hosts are affected.
- Determine whether the problem follows the VM or stays with the host.
- Check link state with
esxcli network nic list. - Compare physical NIC counters with
esxcli network nic stats get. - Watch
%DRPRXand%DRPTXinesxtop–> n. - Check CPU contention when virtual-side drops appear.
- Map the VM port with
net-stats -l. - Capture at the virtual port and uplink with
pktcap-uw. - Check explicit ESXi drop reasons.
- Verify VLAN, MTU, teaming, driver, firmware, and upstream switch counters.
Final Words
The most effective approach is to follow the packet instead of guessing the component. Once you can show that a frame entered one stage of the ESXi datapath but did not leave the next, packet loss becomes a smaller and testable problem.
That evidence usually points to the correct layer far faster than changing adapters, drivers, switch policies, or VM settings without first proving where the drop occurs.
External References
-
Packet Capture on ESXi Using pktcap-uw
Broadcom reference for using
pktcap-uwand capturing traffic at VM switchports, physical uplinks, and other points in the ESXi datapath. -
ESXTOP Overview for Performance Troubleshooting
Broadcom guide for using
esxtopto investigate CPU, memory, storage, and network performance, including%DRPRXand%DRPTX. - Dropped Receive Packets at the ESXi Virtual Switch Broadcom explanation of receive packet drops between the virtual switch and guest network driver, including RX buffer and CPU-related conditions.
- ESXi Physical NIC Receive Packet Drops at RX Queue Level Broadcom troubleshooting guidance for increasing physical NIC receive-drop counters and driver-level RX queue discards.
- Mitigating VMXNET3 Packet Drops Due to Receive Queue Exhaustion Broadcom guidance for diagnosing VMXNET3 receive queue and ring-buffer exhaustion under heavy network load.
-
Testing VMkernel Network Connectivity with vmkping
Official Broadcom reference for using
vmkping, selecting a VMkernel interface, and validating MTU and Jumbo Frame connectivity. - Troubleshooting VLAN Tag Mismatch with pktcap-uw Broadcom example of using ESXi packet captures and explicit drop reasons to identify VLAN tagging mismatches.
-
Network Traffic Impact When Using pktcap-uw
Broadcom operational guidance for using
pktcap-uwsafely and avoiding excessive or long-running capture sessions on busy ESXi hosts.
