
This article shows a practical workflow for NSX troubleshooting communication failures between two virtual machines connected to the same NSX overlay segment but running on different ESXi Host Transport Nodes.
In this scenario, VM A and VM B are connected to the NSX Web Segment. Because the VMs reside on different ESXi hosts, their traffic must traverse the NSX overlay between the source and destination Transport Endpoint (TEP) interfaces.
The troubleshooting workflow starts at the guest operating system and gradually moves through the NSX segment, Transport Nodes, TEP connectivity, Traceflow, and packet capture.
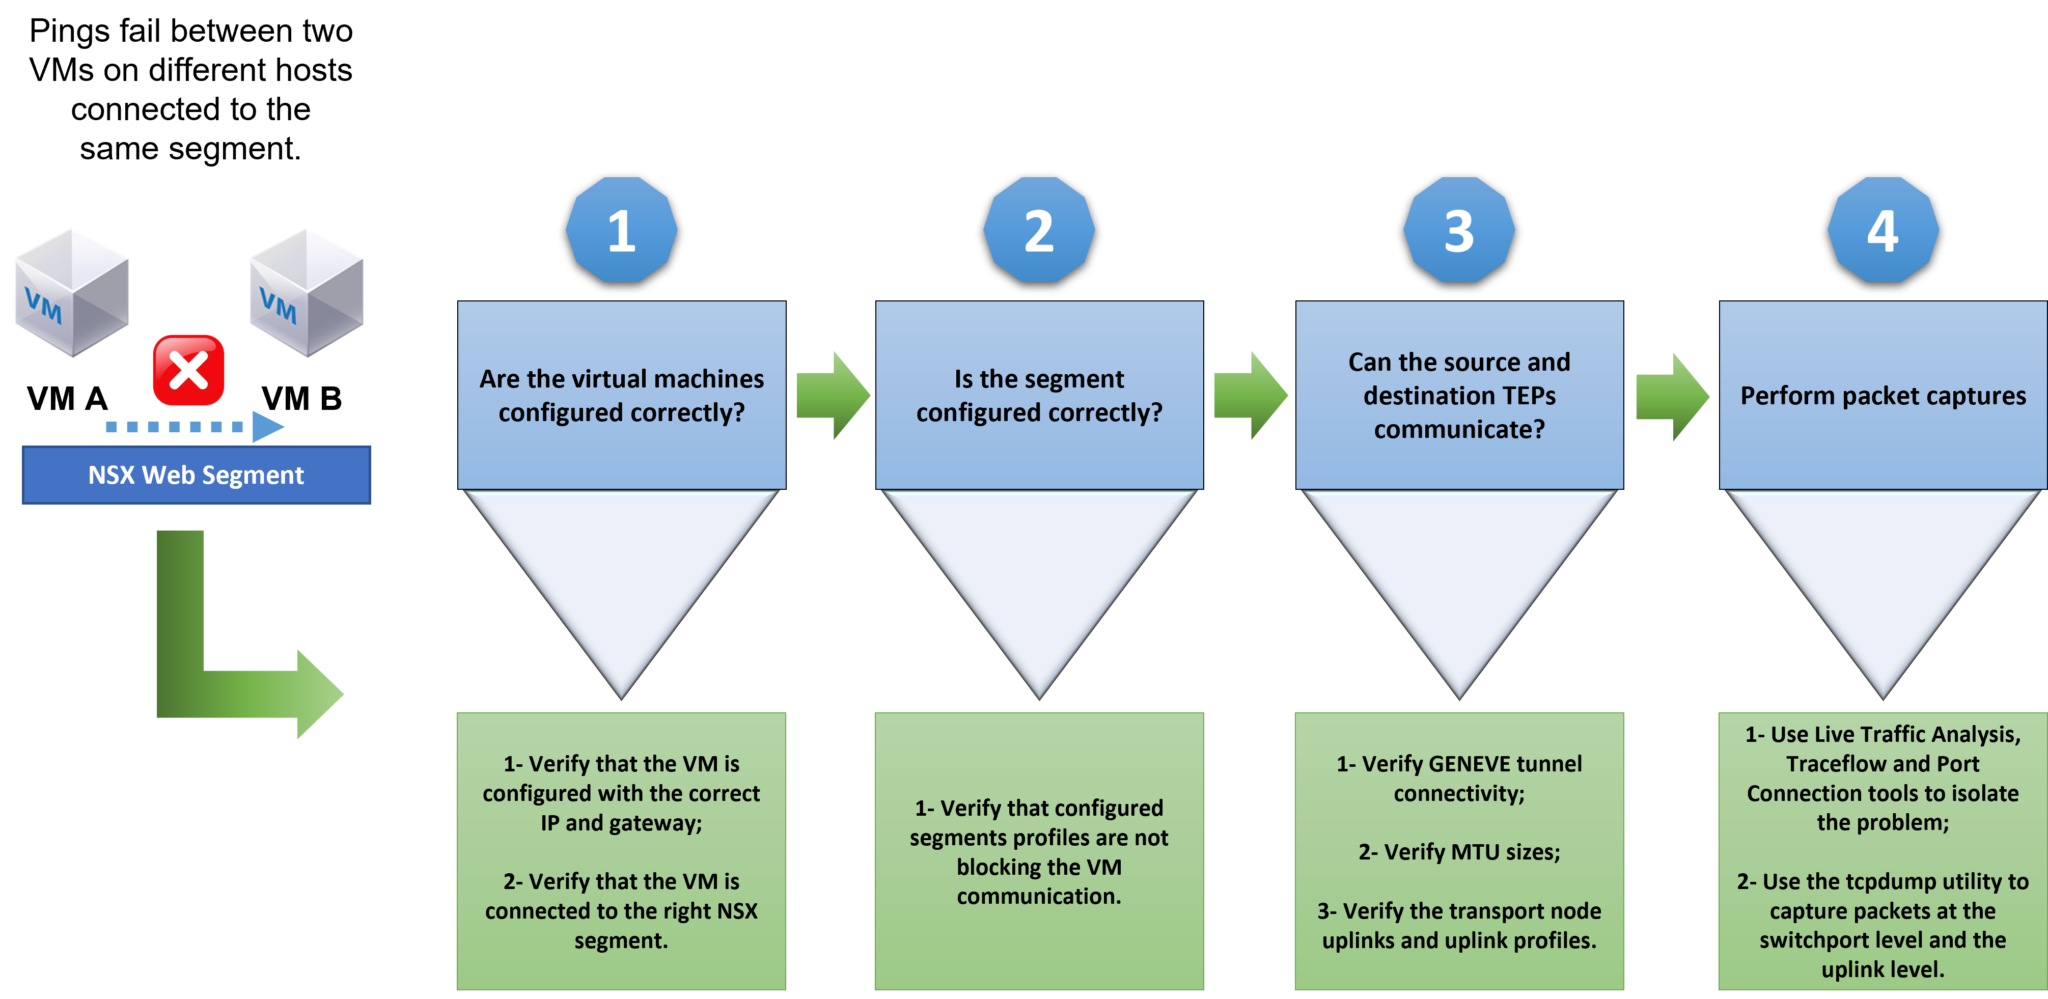
Step 1: Are the virtual machines configured correctly?
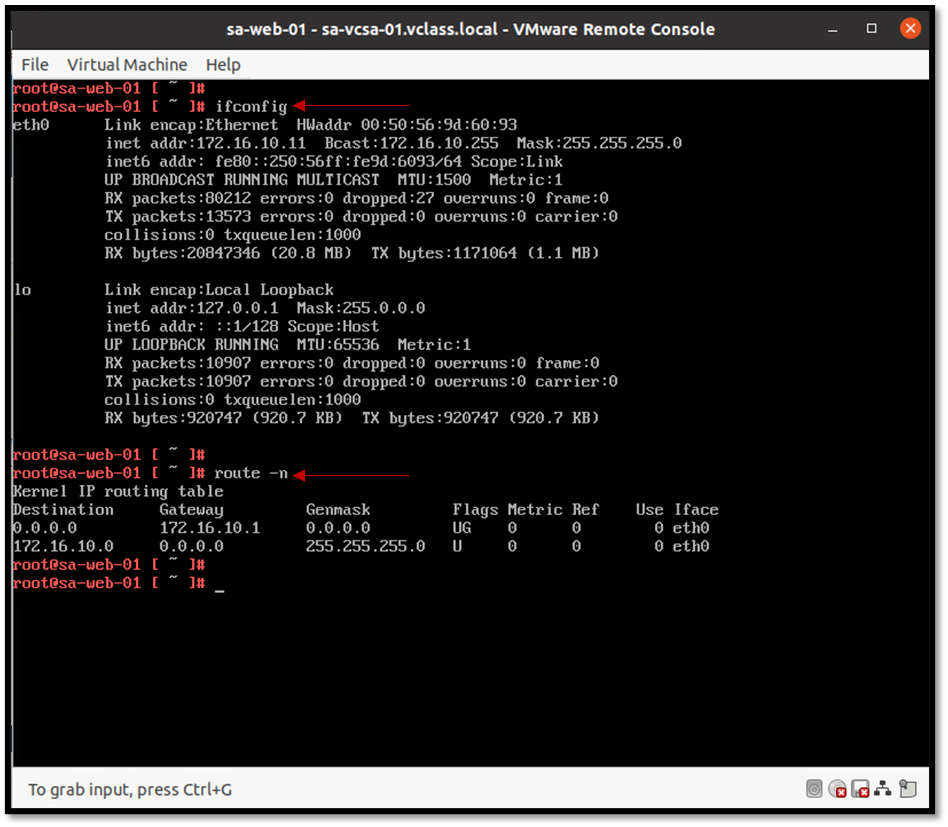
To begin with, a good starting point is to check the Guest OS network configuration. Access the Guest OS VM and check the network configuration (check IP, netmask, default gateway, and configured DNS servers). For example:
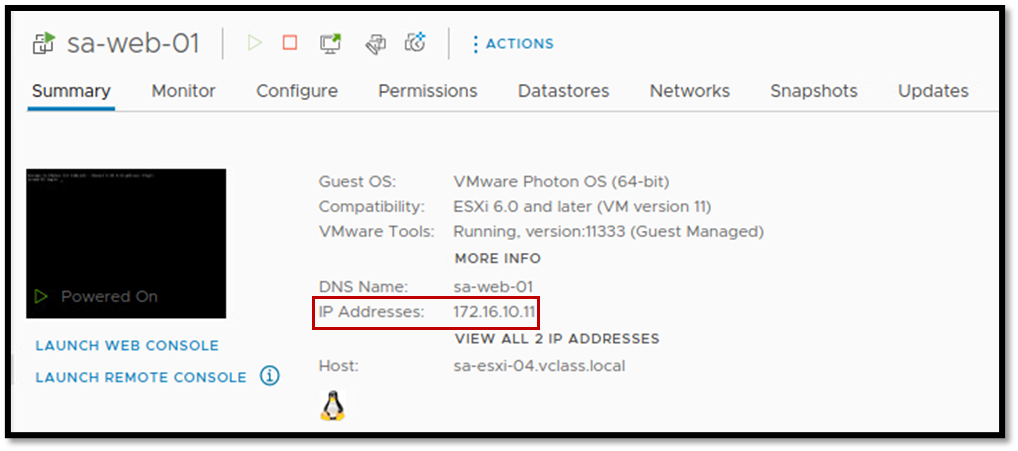
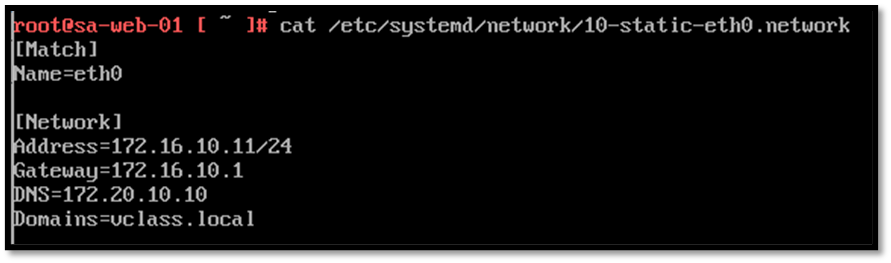
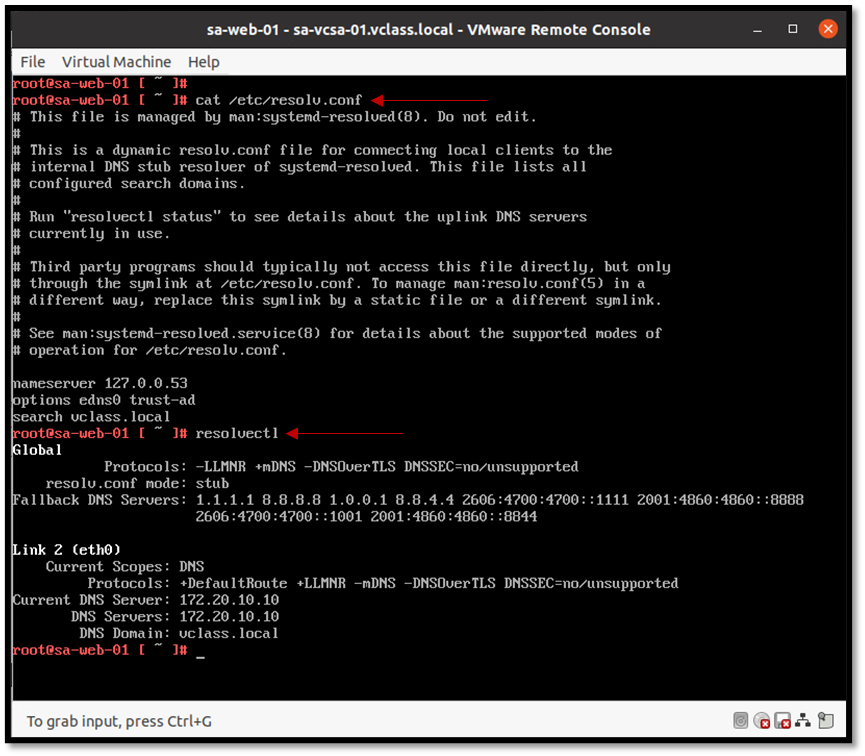
Additionally, check the assigned port group to confirm if the VM is using the right NSX segment:
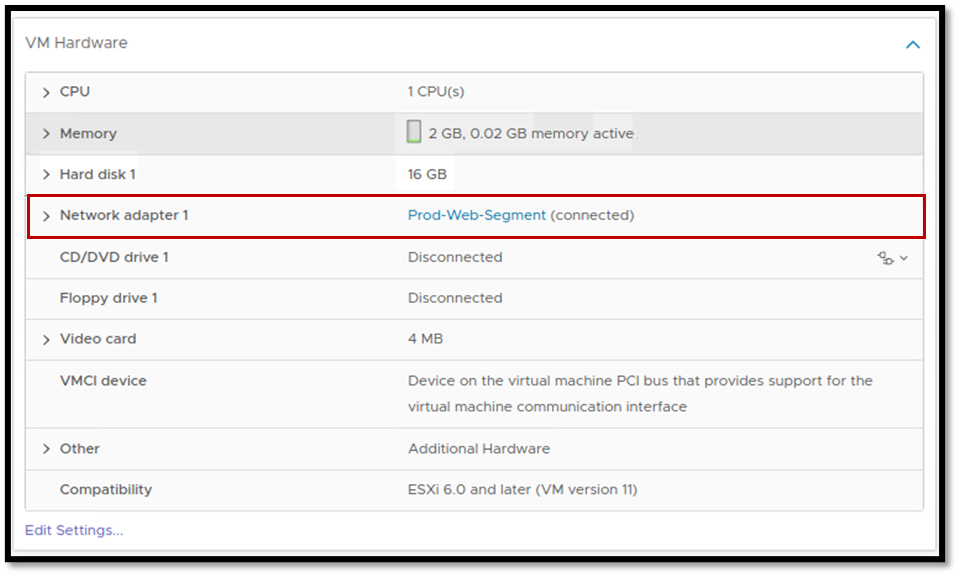
Tip: Check those details in both VMs (the source and the destination VM).
For a direct VM-to-VM connectivity test, use the destination IP address first. This avoids confusing a DNS-resolution problem with an NSX dataplane problem.
Step 2: Is the segment configured correctly?
Each NSX segment has some profiles. Are there any custom segment profiles applied to your profile?
This is a thought-provoking question and needs to be checked. Some profiles such as “Spoof Guard” or “Segment Security” can block the VM communication for some reason. If you have a custom profile, it is a good idea to review each one.
Additionally, access the NSX Manager Appliance and check if the NSX segment is “up” (we can administratively disable an NSX segment). So, here, check if the NSX segment is “up”:
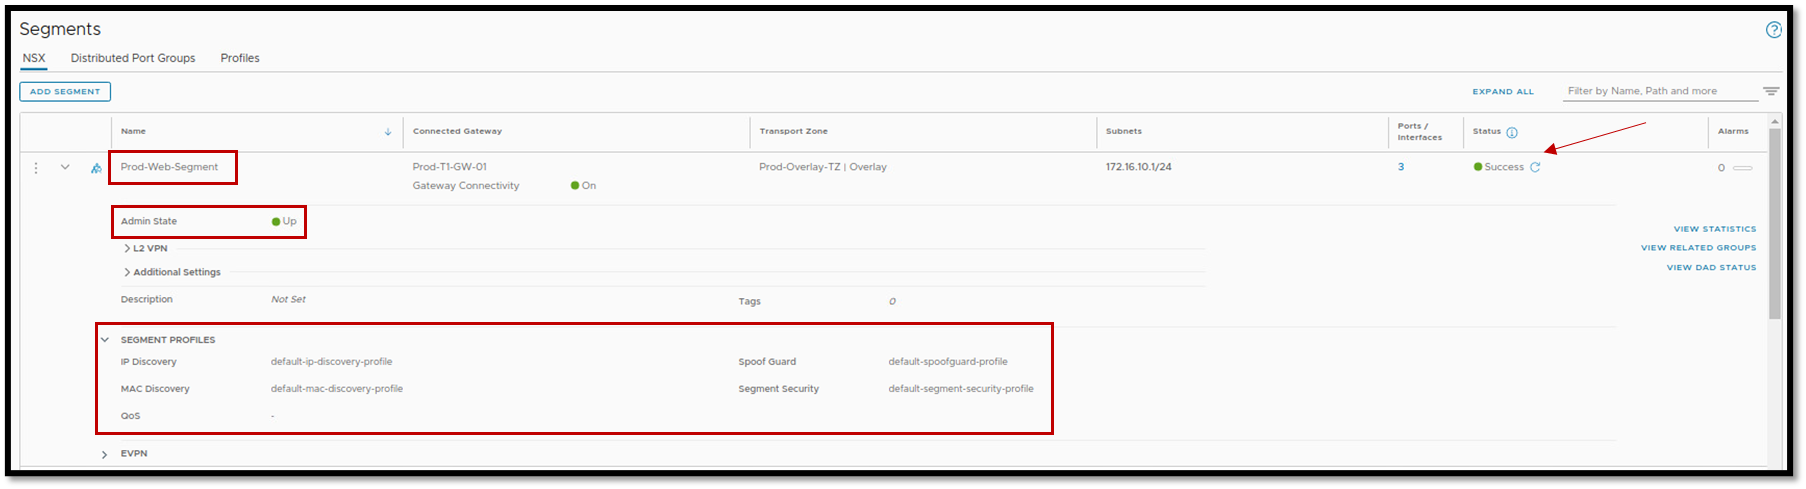
Review the profiles applied to the affected segment and its logical ports, especially custom SpoofGuard, Segment Security, IP Discovery, and MAC Discovery profiles.
A restrictive profile can legitimately drop traffic when the observed IP or MAC information does not match the expected bindings.
Do not change a security profile simply to see whether connectivity returns. First use Traceflow to determine whether the packet is actually being dropped by one of these mechanisms. If a profile change is required for testing, perform it only in a controlled environment and document the original configuration.
Step 3: Can the source and destination TEPs communicate?
Each ESXi Host Transport Node uses physical uplinks mapped through the NSX Uplink Profile. Depending on the network design, these physical NICs may be dedicated to NSX traffic or shared with other vSphere services.
It’s interesting to check if each interface is “up”. Check it on both ESXi hosts (the source and the destination ESXi host).
We can use the command “net-dvs” to show what uplink interfaces have been used by NSX and use the esxcli command to check the status of each vmnic interface, as we can see in the following example:
net-dvs | grep -i nsxUplink

esxcli network nic list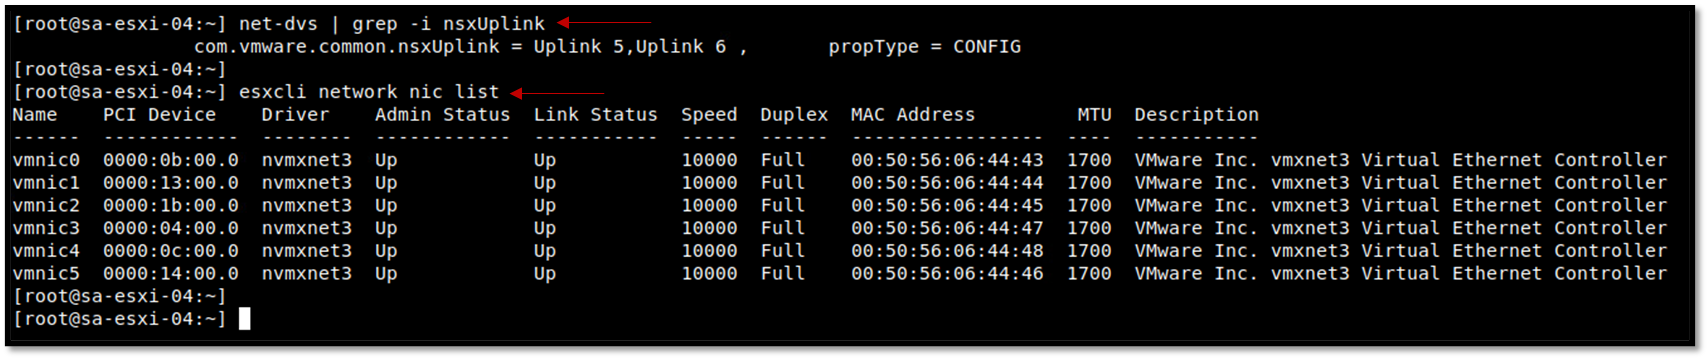
The “esxtop” command can be used to check what vmnic interface is the active interface for NSX traffic. After executing the esxtop, press “n” to access the network view. Look in the column “USED-BY” for the interfaces “vmk10” and “vdr-vdrPort” (both interfaces are used by the NSX). In this case, for instance, both interfaces are using the vmnic4 physical interface:
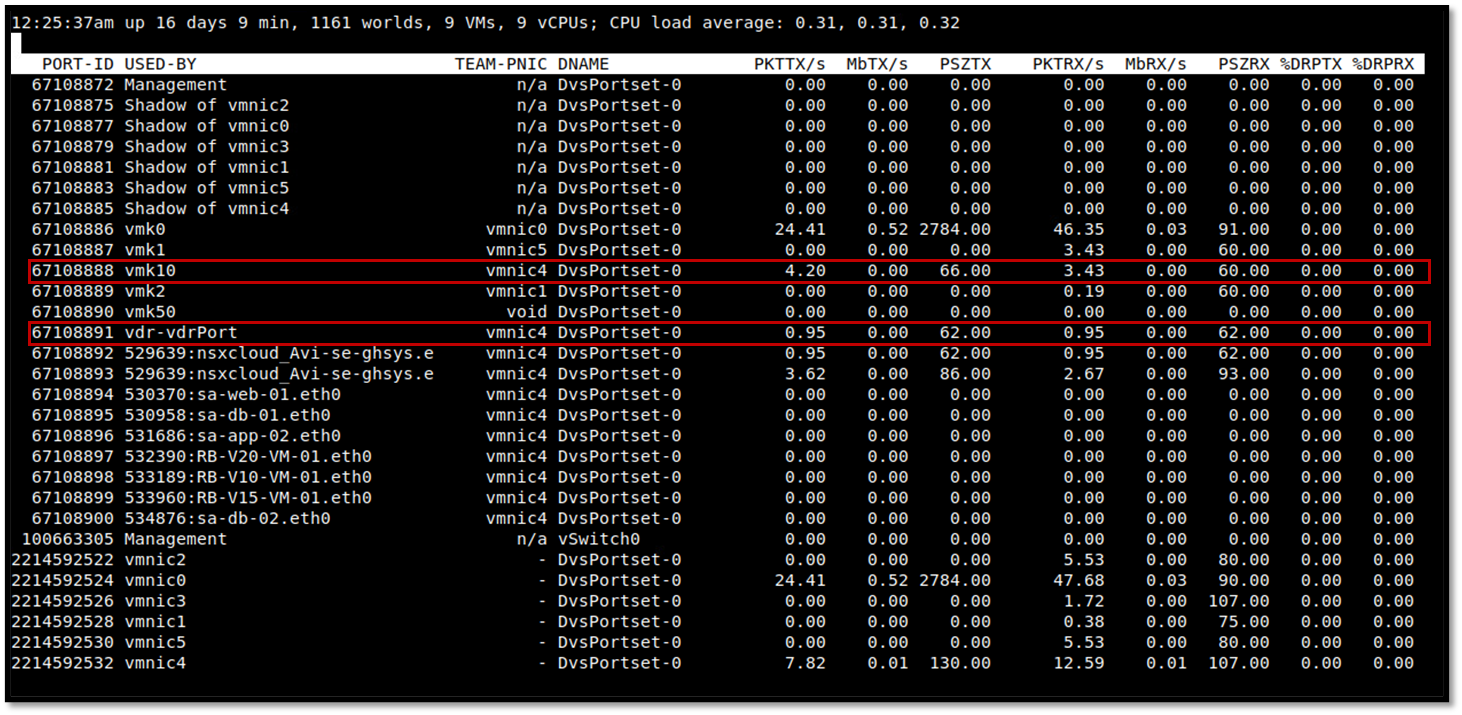
If vmnics for NSX is “up”, check if the vmkernel interface (vmk10) has an IP address in your TEP network. Try to ping each ESXi host using this vmkernel interface and using the configured MTU size:
esxcfg-vmknic -l
Validate TEP-to-TEP Connectivity
First identify the VMkernel interface used as the NSX TEP:
esxcfg-vmknic -lThen test basic connectivity from the source TEP to the destination TEP:
vmkping -S vxlan -I vmk10 -d -s 1472 <DESTINATION_TEP_IP>Next, validate that the underlay supports the minimum MTU required for NSX overlay traffic:
vmkping -S vxlan -I vmk10 -d -s 1572 <DESTINATION_TEP_IP>vmkping -S vxlan -s 1572 -d <DESTINATION_TEP_IP>Notes:
- The
-svalue represents the ICMP payload used byvmkping; it is not the configured MTU itself.
- A 1572-byte test is commonly used by Broadcom to verify that the underlay can carry the approximately 1600-byte packet required for NSX Geneve overlay traffic without fragmentation.
- If the 1472-byte test succeeds but the 1572-byte test fails, investigate the MTU configuration across the physical switches, routed interfaces, vDS, and TEP path.
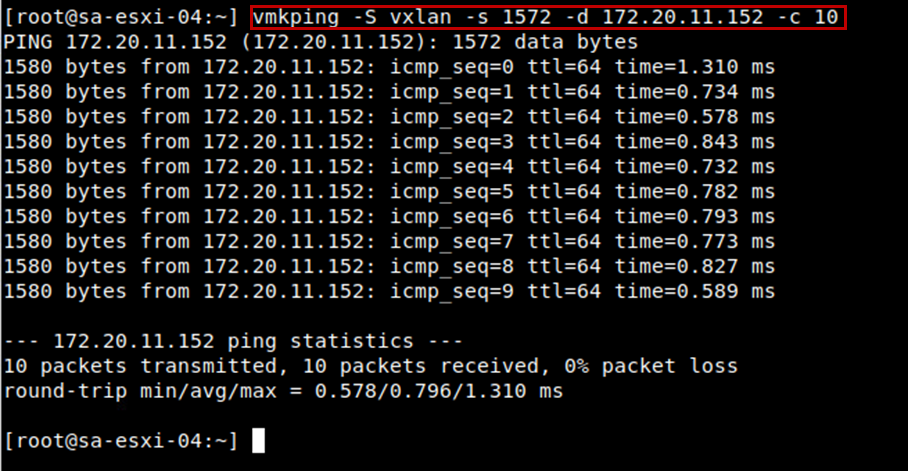
Tip: Perform those tests in both ESXi hosts (the source and the destination ESXi hosts).
Check the NSX Tunnel State
On both ESXi Transport Nodes, run:
nsxdp-cli bfd sessions listReview the BFD sessions associated with the remote TEPs and confirm that the expected tunnels are in an UP state.
A successful TEP-to-TEP vmkping confirms IP connectivity through the underlay, but it does not by itself prove that the NSX overlay tunnel is operational. BFD sessions can still be down even when TEP ping succeeds.
For a deeper investigation of TEP, MTU, and BFD tunnel problems, see “Troubleshooting NSX Overlay TEP Connectivity from ESXi and Edge Nodes“.
Step 4: Use Traceflow and Packet Capture to Locate the Drop
Furthermore, inside the NSX Manager Appliance UI, there are powerful tools to perform some tests.
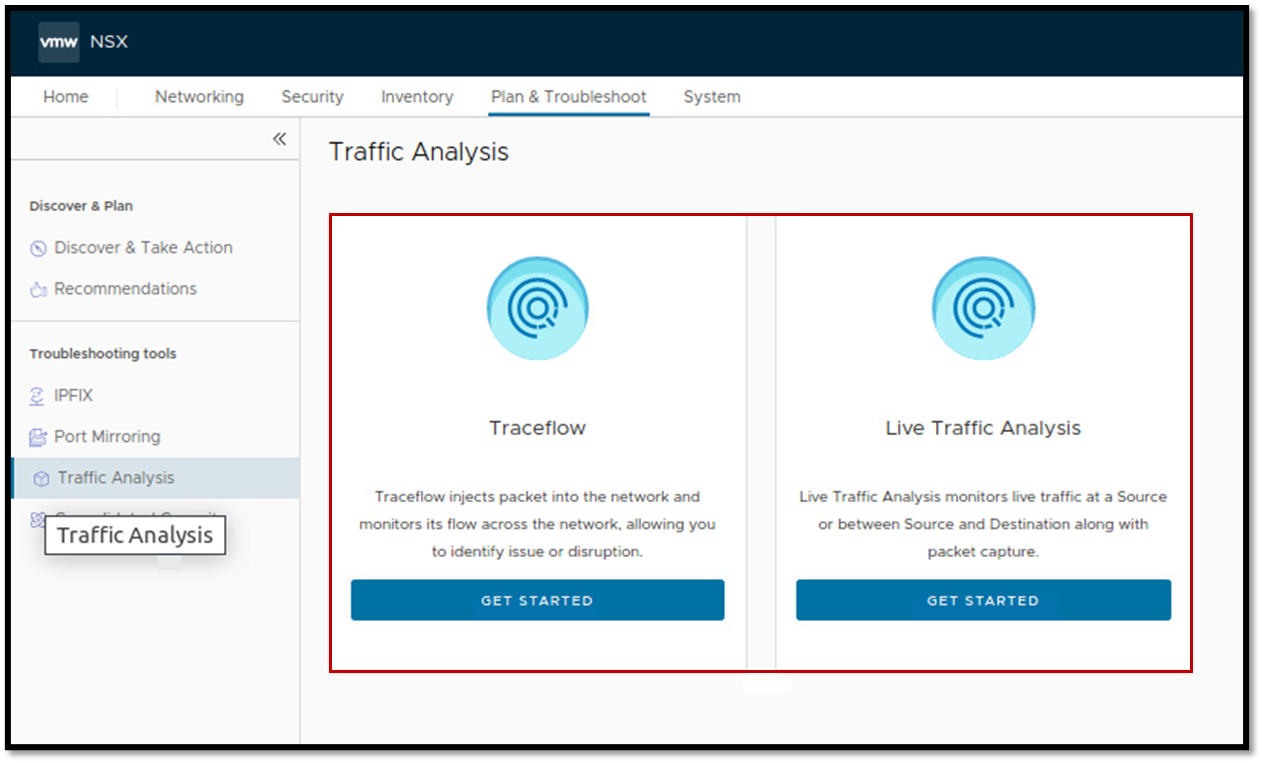
The first one is the Live Traffic Analysis. This tool monitors live traffic at a source or between a source and destination along with packet capture.
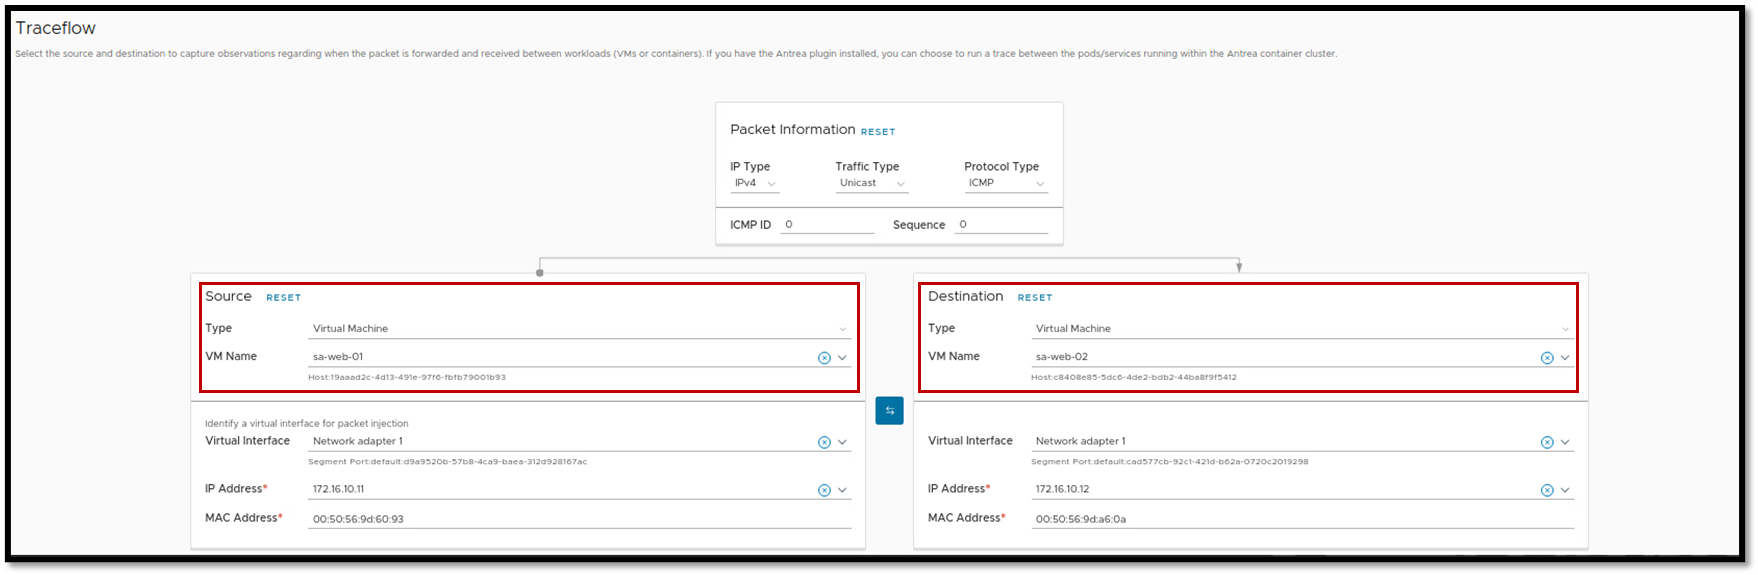
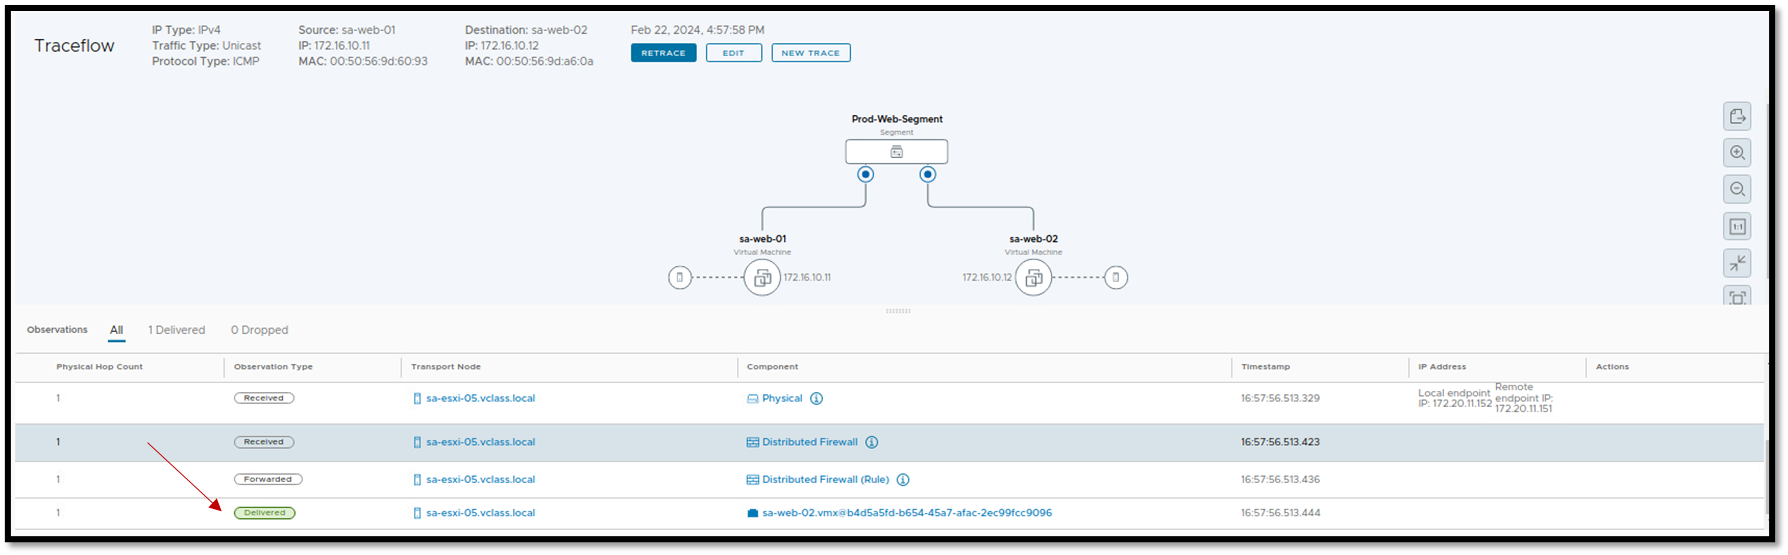
The second is the Traceflow. This tool injects packets into the network and monitors their flow across the network, allowing you to identify issues or disruptions.
Start with Traceflow before packet capture whenever possible. Traceflow can identify the logical component or firewall rule responsible for a drop and may eliminate the need for deeper packet captures:
Another option is to perform a packet capture directly from the NSX datapath on the ESXi host using nsxcli.Here, we can capture the sample of the traffic in different places through the infrastructure between the source and the destination VM.
To capture the traffic leaving the vNIC of the source VM (sa-web-01), for instance, the following command can be used on the source ESXi host (the ESXi host that runs the source VM).
1- Get the client VM name (in this case, for instance, the VM name is sa-web-01):
nsxcli -c get ports | egrep -i "Client|sa-web-01"
2- This example captures ICMP traffic entering the NSX datapath through the source VM logical interface. Replace sa-web-01.eth0 with the client interface identified in your environment:
nsxcli

start capture interface sa-web-01.eth0 direction input expression ipproto 0x01
Where:
— sa-web-01.eth0 = Client interface name. Change this name to your client interface name.

Do the same thing for the destination VM on the destination ESXi host.
If Traceflow shows that the traffic is being rejected by a Distributed Firewall rule, see “Troubleshooting NSX Distributed Firewall with Traceflow: Practical Lab Scenario“ for a complete example of identifying the exact firewall Rule ID and correcting the policy.
Optional: Capture the VM Traffic with pktcap-uw
First identify the VM switchport:
nsxdp-cli vswitch instance listThen capture traffic at the VM virtual switchport:
pktcap-uw \
  --switchport <switchport-id> \
  --capture VnicTx,VnicRx \
  -o - | tcpdump-uw -enr - -nn
Perform the capture on both the source and destination ESXi hosts when necessary. Seeing a packet leave the source VM but never arrive at the destination host significantly narrows the failure domain.
If the problem appears to be a packet drop inside the ESXi datapath rather than an NSX policy or TEP issue, see “How to Troubleshoot Packet Drops on an ESXi Host“.
What This Troubleshooting Workflow Helps You Isolate
Troubleshooting NSX connectivity is easier when each layer is validated separately.
Start by confirming the Guest OS configuration and segment attachment. Then verify the NSX segment and its security profiles, followed by the physical uplinks, TEP IP connectivity, MTU, and BFD tunnel state.
If the underlay and overlay are healthy, use Traceflow to determine whether the packet is being dropped by the Distributed Firewall or another NSX component. Packet captures should then be used when the failure needs to be traced deeper through the ESXi datapath.
Following this sequence helps avoid changing firewall rules, segment profiles, or transport-node configuration before the actual failure domain has been identified.
External References
-
Troubleshooting NSX TEP/BFD Tunnels Between Transport Nodes
Broadcom troubleshooting reference for TEP connectivity,
BFD tunnel state, the NSX overlay network stack, and
vmkpingtesting between Transport Endpoints. -
Validate NSX TEP Connectivity and MTU with vmkping
Official Broadcom example using the TEP VMkernel interface,
-S vxlan, Don’t Fragment testing, and a 1572-byte payload to validate the NSX overlay MTU path. -
BFD Tunnels Are Down Between ESXi Hosts in an NSX Environment
Broadcom example demonstrating that TEP-to-TEP IP connectivity
can succeed while the NSX BFD tunnel remains down, highlighting
the importance of checking
nsxdp-cli bfd sessions list. - Troubleshooting VMware NSX Using Packet Captures Broadcom guide for using Traceflow before deeper packet captures and for capturing East-West and North-South traffic at VM switchports and ESXi uplinks.
- Traceflow Drop Reason: SpoofGuard Broadcom example showing how Traceflow can identify traffic rejected by an NSX SpoofGuard profile when source MAC or address bindings do not match the expected VM configuration.
-
Troubleshooting Virtual Machine Connectivity with Packet Capture
Broadcom workflow for tracing VM traffic at the ESXi
virtual switchport with
pktcap-uwand validating Layer 2 ARP behavior before investigating higher-layer traffic.
