

Packet loss troubleshooting can become difficult because the symptoms often look similar regardless of where the problem actually occurs. A slow application, unstable SSH session, failed API request, or poor storage performance may all eventually lead an administrator to suspect that packets are being dropped somewhere along the communication path.
The real challenge in packet loss troubleshooting is not simply proving that packets are being lost, but determining where the loss happens. A Linux server can lose packets because of local interface errors, overloaded queues, kernel processing limits, switch problems, upstream congestion, firewall behavior, or issues much farther away from the system being investigated.
A useful troubleshooting process therefore needs to separate the local host from the network around it. Instead of immediately blaming the switch, router, or remote server, the investigation should move progressively from the Linux interface toward the destination, collecting evidence at each layer.
Start by Confirming That Packet Loss Really Exists
The first mistake during packet-loss troubleshooting is relying only on application symptoms. A delayed web request or interrupted SSH session does not automatically mean packets are being discarded.
A simple starting point is ping:
ping -c 20 192.168.1.1The summary shows how many packets were transmitted, received, and lost.
For example:
20 packets transmitted, 20 received, 0% packet lossIf loss is reported, repeat the test against several targets. The important detail is not only whether packets are lost, but where the loss begins.
A practical sequence might be:
ping -c 20 127.0.0.1
ping -c 20 <local_interface-IP>
ping -c 20 <default-gateway>
ping -c 20 <remote-host>
These four tests examine progressively larger parts of the communication path (from the local system to the destination system).
If the loopback test fails, the problem is clearly local to the system. This situation is uncommon, but it immediately changes the direction of the investigation.
If the local interface IP works but the default gateway shows loss, the issue is more likely associated with the interface, local cabling, VLAN, virtual switch, physical switch, or Layer 2 path.
If the gateway is completely stable while a remote destination loses packets, the investigation should move beyond the local segment.
Check the Linux Interface Counters
Before investigating routers or remote networks, inspect the network interface itself.
Use:
ip -s linkThe command displays packet statistics for every interface, including received packets, transmitted packets, errors, dropped packets, overruns, and other counters.
A typical interface may display something similar to:
RX:  bytes  packets  errors  dropped  missed  mcast
     984321  10542    0       0        0       241

TX:  bytes  packets  errors  dropped  carrier  collsns
     756221  8211     0       0        0        0
For example:
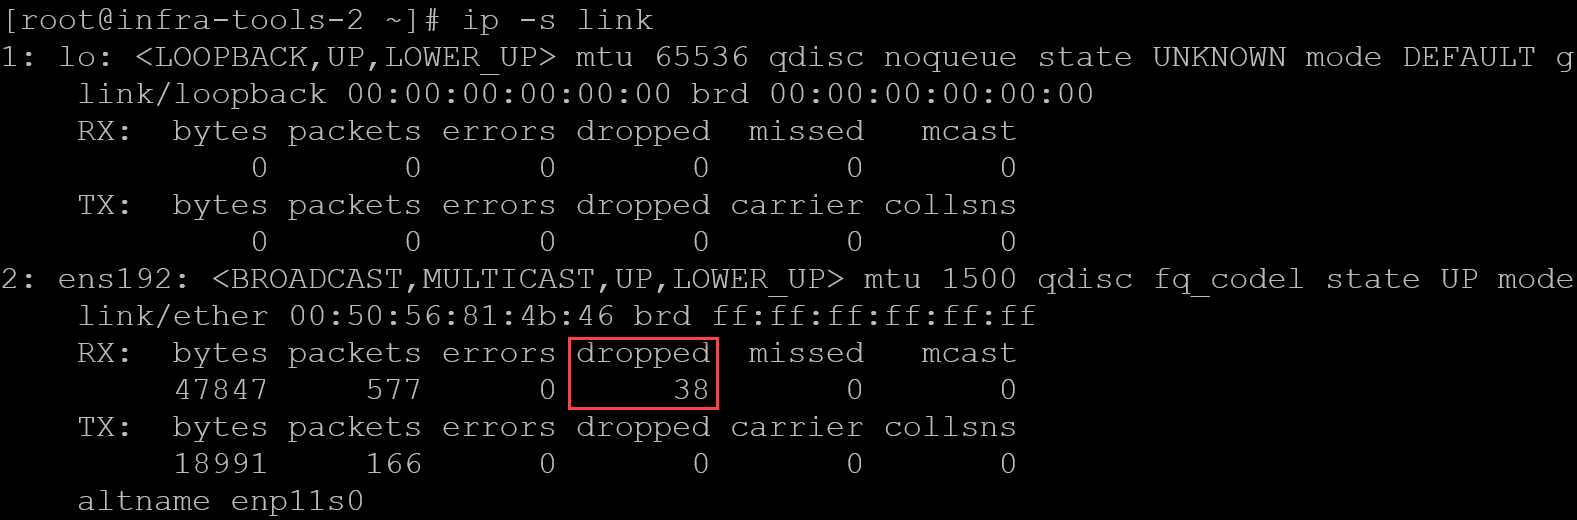
💡 Do not focus only on the absolute values. A server that has been running for several months may already contain old errors that are no longer relevant. What matters during troubleshooting is whether the counters continue increasing while the problem occurs.
Run the command once (replace the eth0 with your interface, if necessary):
ip -s link show eth0Generate or observe traffic for a few minutes and run it again. If errors or dropped increase consistently while the problem occurs, there is evidence that packets are being affected at or near the Linux networking path. The exact meaning depends on the counter and the network driver, so correlate the generic interface statistics with ethtool -S.
RX errors may indicate problems involving the physical interface, driver, cable, transceiver, switch port, or frame reception.
Dropped packets require more careful interpretation because packets can also be discarded when the kernel cannot process incoming traffic fast enough, for example.
Inspect Link Negotiation and Physical Characteristics
When interface errors are increasing, verify the negotiated connection. For Ethernet interfaces, ethtool is extremely useful:
ethtool eth0Pay attention to values such as:
Speed: 1000Mb/s
Duplex: Full
Auto-negotiation: on
Link detected: yes
Example:
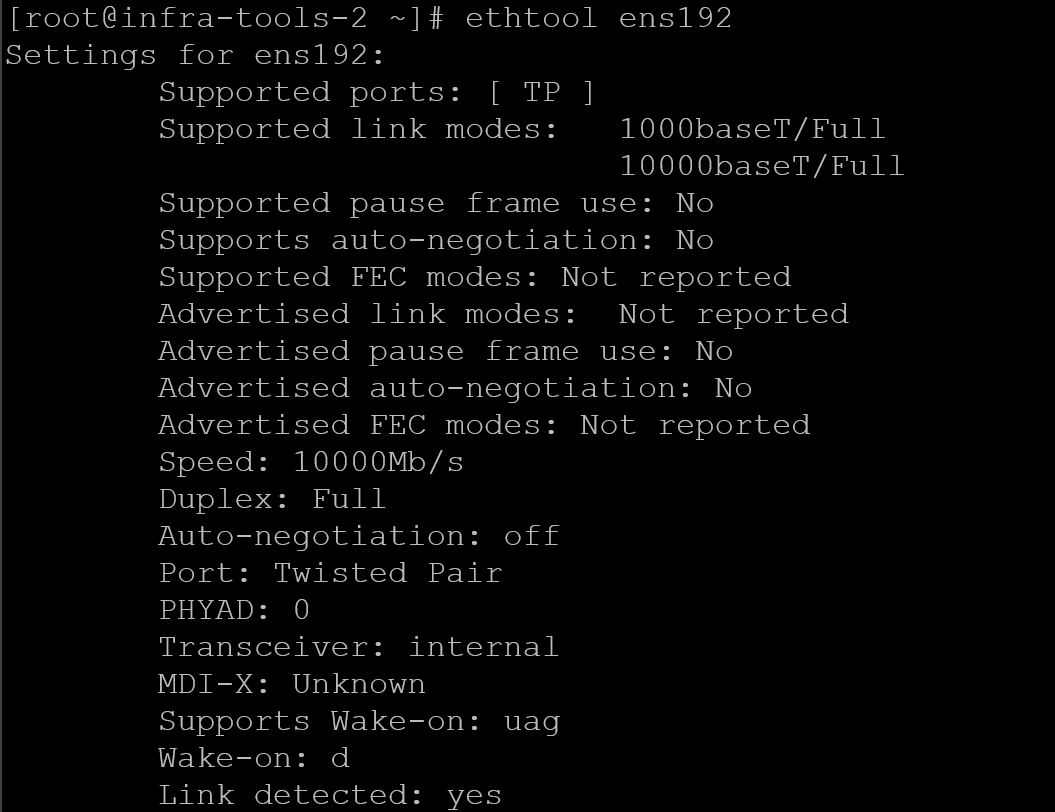
A mismatch between expected and negotiated speed can explain severe performance degradation.
Duplex problems are less common on modern networks using auto-negotiation, but they should still be considered when working with older devices, unusual switch configurations, or manually configured interfaces.
Driver statistics can provide additional clues:
ethtool -S eth0The available counters depend on the network adapter and driver, but you may see statistics related to CRC errors, missed packets, queue drops, buffer exhaustion, or hardware-specific receive failures.
Repeated CRC-related errors, for example, strongly suggest investigating the physical path rather than blaming TCP or the application.
Test the Default Gateway Separately
The default gateway is one of the most useful reference points during this type of investigation.
Find it with:
ip routeA typical result may look like:
default via 192.168.10.1 dev eth0 proto staticThen test it directly:
ping -c 100 192.168.10.1If packet loss already occurs between the server and its gateway, troubleshooting the internet or a remote data center is premature.
At that point, investigate components such as:
- The Linux network interface;
- Virtual NIC or hypervisor networking;
- If the Linux server is a virtual machine running on VMware ESXi and the evidence points beyond the guest operating system, see “How to Troubleshoot Packet Drops on an ESXi Host“.
- Network cable or transceiver;
- Access switch;
- VLAN configuration;
- Bonding or teaming;
- Local firewall processing;
- Interface congestion.
If the gateway responds perfectly while a remote destination shows loss, the local Ethernet segment becomes less suspicious. This does not prove that the server is completely healthy, but it provides an important boundary.
Compare Multiple Destinations
A single destination can easily mislead the investigation.
Suppose this test reports 8% loss:
ping -c 100 server.example.netThat does not prove the local network is losing packets.
The destination may intentionally rate-limit ICMP, the remote firewall may deprioritize ping replies, or an intermediate router may treat ICMP differently from production traffic.
Compare several destinations instead:
ping -c 50 <gateway>
ping -c 50 <internal-server>
ping -c 50 <remote-server-A>
ping -c 50 <remote-server-B>
ping -c 50 <remote-server-C>
Patterns are much more valuable than isolated results:
- If every destination, including the gateway, shows loss, look locally.
- If local systems remain stable but several external destinations exhibit similar loss, investigate the upstream network.
- If only one specific remote host shows problems, the issue may be located near that host or somewhere along its particular route.
Use MTR to Observe the Path
mtr combines characteristics of ping and traceroute, making it useful for identifying where communication quality appears to change.
A report can be generated with:
mtr -rwzbc 10 example.comFor example:
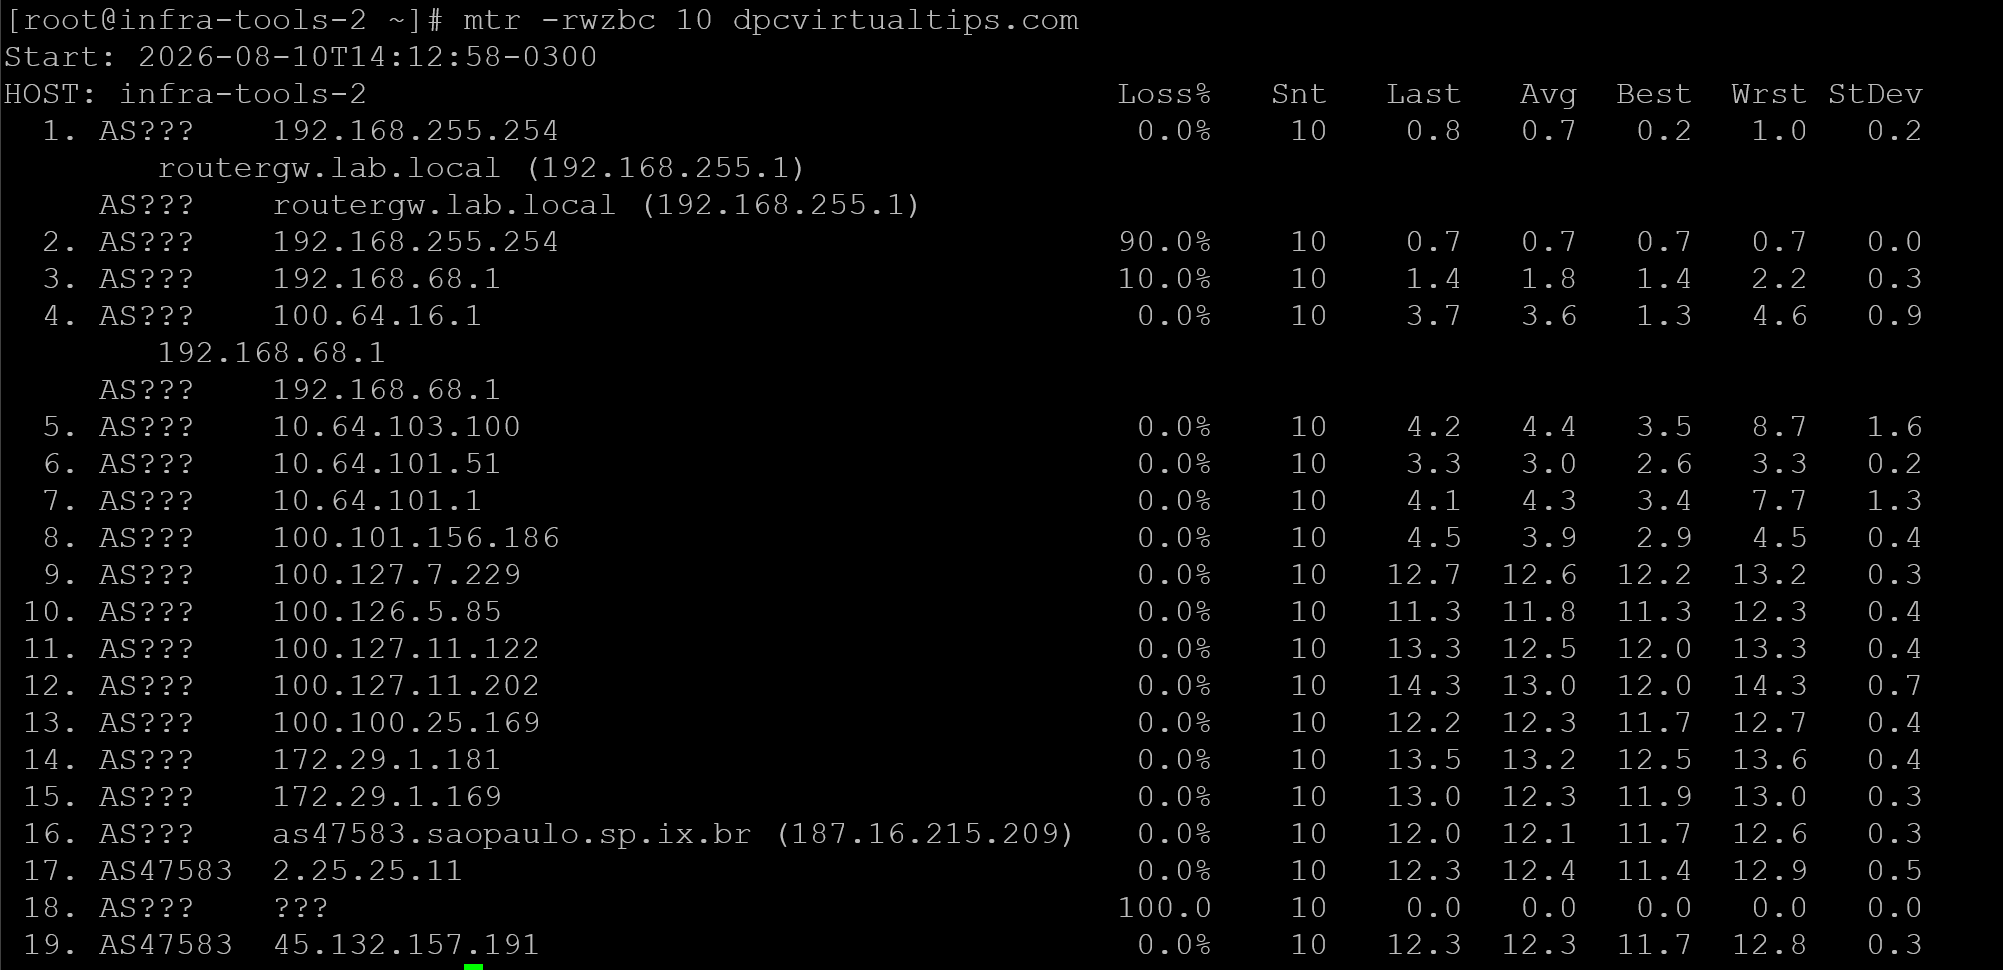
Depending on the installed version, options may differ slightly, but the objective is to collect repeated measurements across the route rather than relying on a single traceroute.
The output may show something similar to:
HOST: linux01
  1. 192.168.10.1       0.0%
  2. 10.20.0.1          0.0%
  3. 172.18.50.1        8.0%
  4. 203.0.113.10       0.0%
  5. destination        0.0%
This example demonstrates an important troubleshooting rule:
- Loss shown at one intermediate hop does not necessarily mean that router is actually dropping forwarding traffic.
- Routers frequently rate-limit or deprioritize ICMP responses directed at themselves. If subsequent hops return normally, the apparent loss at that intermediate hop is usually not relevant.
Real path loss becomes more convincing when packet loss begins at one hop and continues through every following hop, including the final destination.
For example:
1. gateway             0.0%
2. router-a            0.0%
3. router-b           12.0%
4. router-c           11.0%
5. destination        12.0%
That pattern deserves investigation around hop 3 or the link immediately before it.
Do Not Trust ICMP Alone
Ping is useful, but production applications normally use TCP or UDP. A firewall or router may handle ICMP differently from HTTPS, SSH, database, or storage traffic.
For TCP-based testing, tools such as mtr may support TCP mode:
mtr --tcp --port 443 example.comYou can also use traceroute with TCP when supported:
traceroute -T -p 443 example.comTesting the actual application port reduces the chance of drawing conclusions from ICMP-specific behavior.
For example, if ICMP appears unstable but TCP connections to port 443 remain completely healthy, the apparent packet loss may simply reflect ICMP filtering or rate limiting.
Look for Packet Drops Inside the Kernel
Not all locally dropped packets appear as physical interface errors. Linux maintains additional network statistics that can expose problems inside the networking stack.
A useful command is:
netstat -sor, on modern systems:
nstatLinux maintains additional statistics that can reveal packets dropped while they are being processed by the kernel network stack.
If the sysstat package is installed, softnet activity can be monitored with:
sar -n SOFT 1 10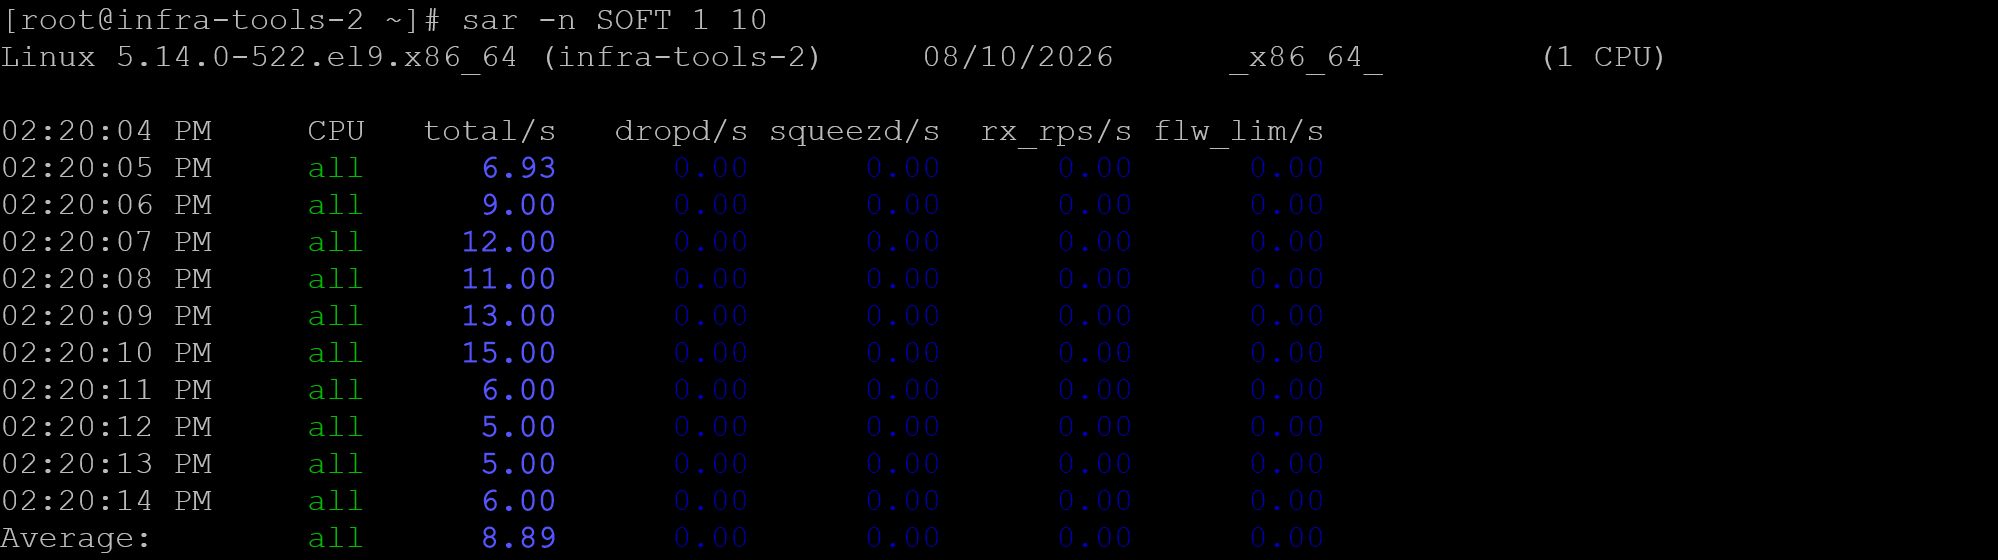
When reading sar -n SOFT, pay particular attention to:
dropd/s: frames dropped because there was no room in the processing queue;squeezd/s: occasions where the networking softirq processing budget or time limit was exhausted.
This is particularly useful when investigating whether the system is struggling to process incoming packets because of CPU pressure or high packet rates.
If sar is not available, first verify whether the sysstat package is installed:
rpm -q sysstatOn RHEL-compatible systems, it can normally be installed with:
dnf install sysstatLinux also exposes the underlying softnet counters directly through:
cat /proc/net/softnet_statBecause these values are presented in a relatively low-level format, sar -n SOFT is usually easier to interpret during routine troubleshooting.
For interface throughput and packet rates, you can separately use:
sar -n DEV 1 10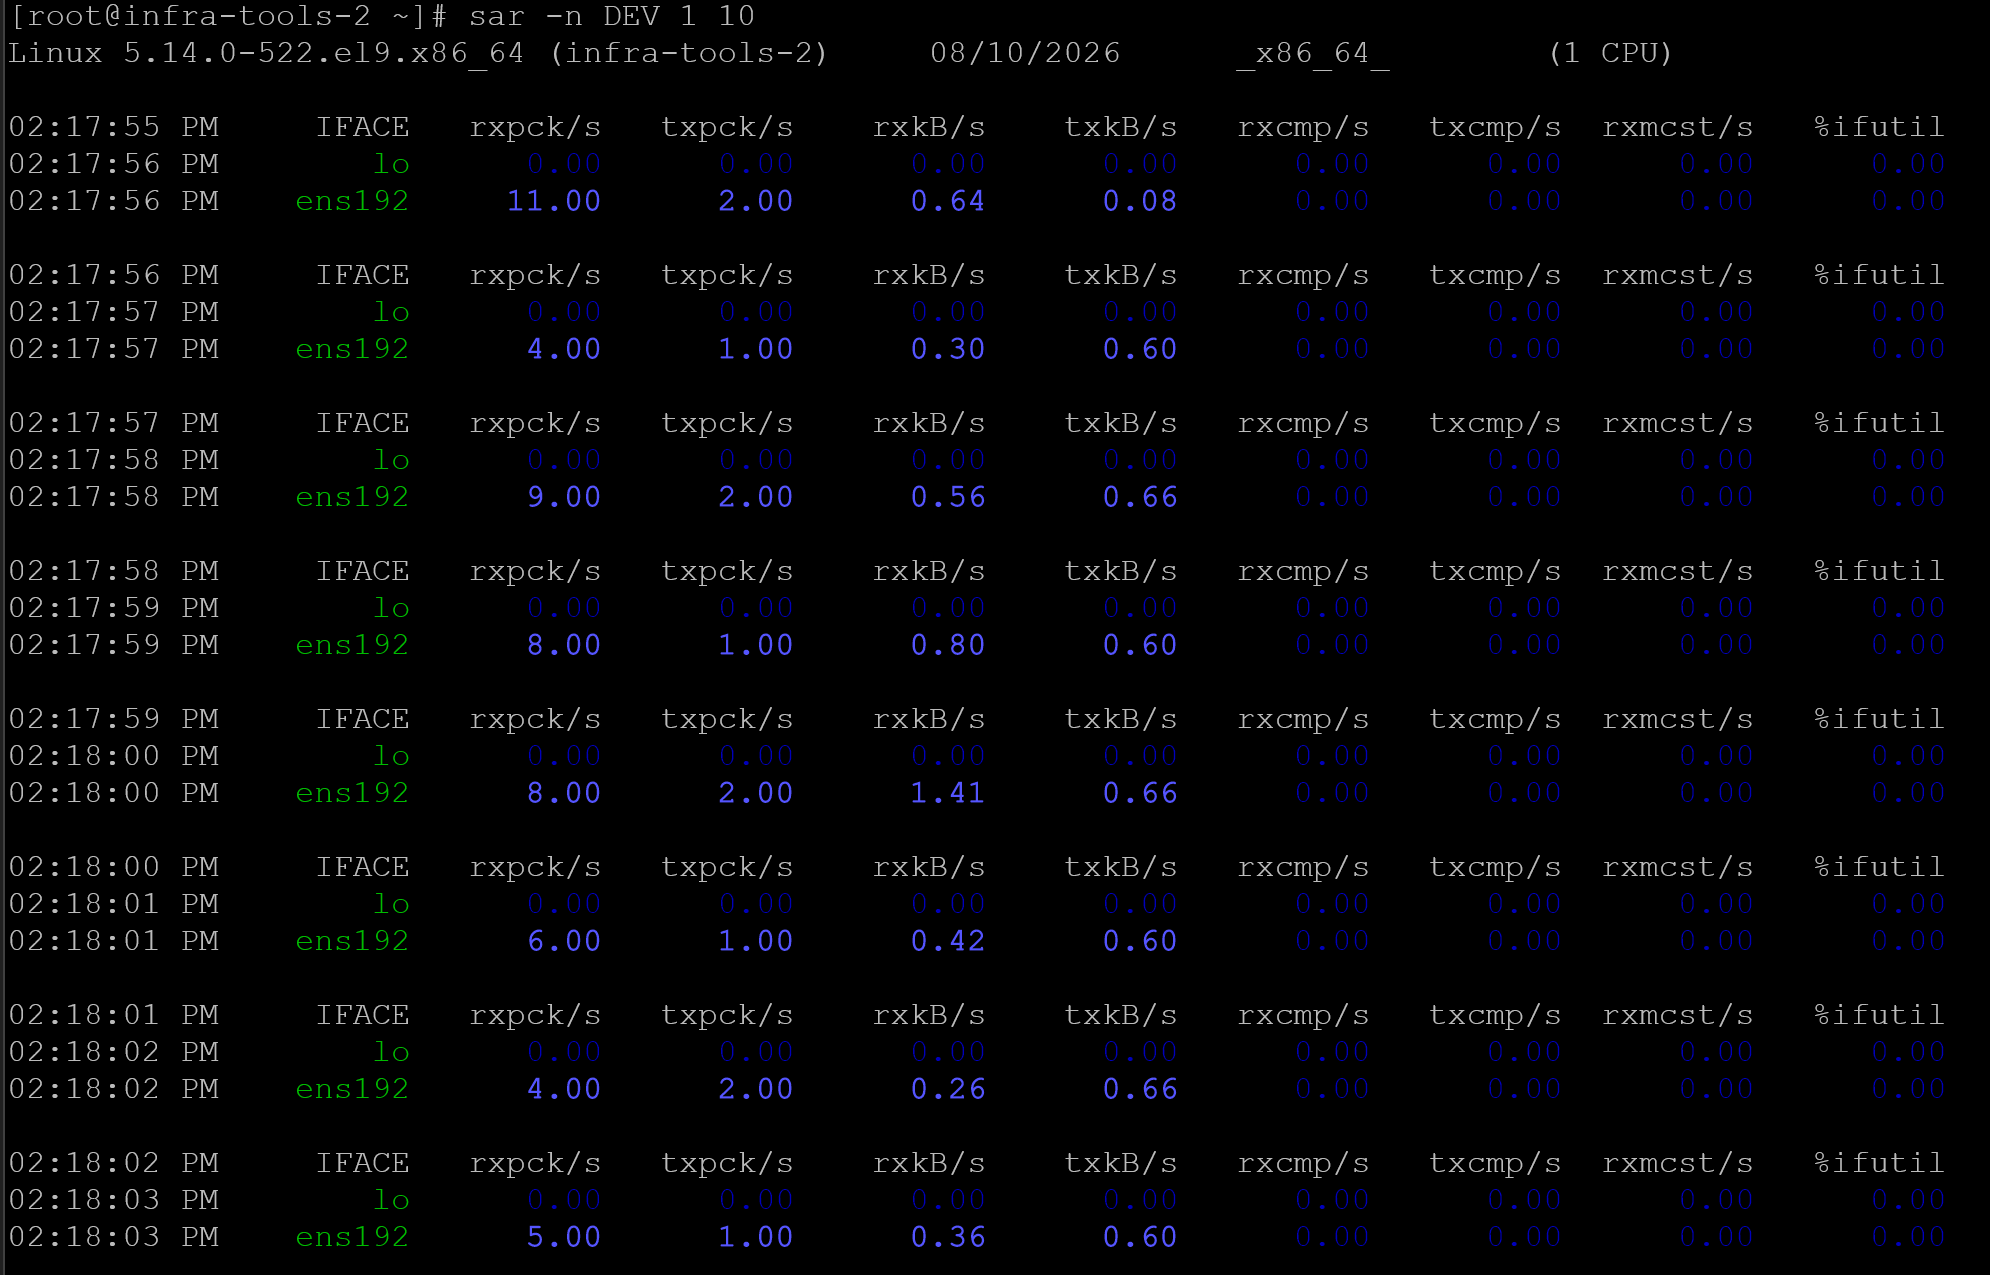
High packet rates combined with increasing softnet drops and CPU saturation can indicate that packet loss is occurring locally because the server cannot process network traffic quickly enough. High traffic combined with CPU saturation may cause the system to struggle with packet processing even when the interface itself is physically healthy.
Check CPU pressure with:
topor:
mpstat -P ALL 1If one or more CPUs are saturated while network drops increase, the issue may be local processing capacity rather than the external network.
This is particularly relevant on high-throughput servers, firewalls, virtualization hosts, storage nodes, and systems receiving large numbers of small packets.
Capture Traffic with tcpdump
When the available counters are not enough, packet capture can help determine whether packets actually reach the server.
For example:
tcpdump -ni eth0 host 192.168.20.50For TCP traffic, look for repeated sequence numbers, repeated SYN packets, duplicate ACK patterns, unexpected resets, or packets that appear on one endpoint but not the other.
tcpdump provides the packet evidence; tools such as Wireshark can make higher-level TCP retransmission analysis easier.
Imagine a client repeatedly sends TCP SYN packets but the Linux server never captures them.
That strongly suggests the packets are being lost before reaching the host. If the SYN packets appear in the capture and the server sends SYN-ACK responses, but the client never receives them, the problem may exist on the return path.
This distinction is important because network routes can be asymmetric. The path from client to server may be completely different from the path used for the response.
Packet capture on both endpoints is even more valuable when possible.
If a packet appears in the sending host capture but never appears on the receiving host, the network between them becomes the primary suspect.
Note: If the investigation shows TCP retransmissions rather than generic packet loss, see “How to Investigate TCP Retransmissions on Linux“ for a TCP-focused workflow.
Check for MTU Problems
Not every apparent packet-loss problem affects small packets. MTU mismatches can allow simple ping tests to succeed while larger application packets fail.
A practical test is:
ping -4 -M do -s 1472 <destination>This example applies to IPv4 and a 1500-byte IP MTU. Different address families, encapsulation, VPNs, tunnels, and overlay networks introduce different overhead and may require different test sizes.
Note: For IPv4, a 1472-byte ICMP payload plus the 20-byte IPv4 header and 8-byte ICMP header produces a 1500-byte IP packet.
If smaller packets succeed but larger packets consistently fail, investigate MTU settings across the route.
Check the local interface with:
ip link show eth0In environments using tunnels, VPNs, VXLAN, virtualization overlays, or jumbo frames, MTU inconsistencies deserve particular attention.
Building an Evidence-Based Packet Loss Diagnosis
Packet loss becomes much easier to investigate when the communication path is divided into measurable sections.
Start with the Linux networking stack and interface counters, establish whether the default gateway is stable, compare multiple destinations, and then move farther into the network only when the evidence supports it.
No single ping, MTR result, interface counter, or packet capture should be treated as definitive proof by itself. The strongest diagnosis comes from correlating several observations collected while the problem is actually occurring.
The objective is to establish a boundary: determine the last point where traffic is healthy and the first point where loss can be demonstrated. Once that boundary is known, the investigation becomes considerably more focused.
External References
- Linux Kernel — Interface Statistics Official Linux kernel documentation explaining network interface counters such as RX/TX errors, dropped packets, missed packets, and driver-specific statistics.
- Linux Kernel — Scaling in the Networking Stack Kernel documentation covering RSS, RPS, RFS, receive processing queues, CPU distribution, backlog behavior, and packet processing under high network load.
- ethtool Manual Page Reference for inspecting Ethernet link state, negotiated speed, duplex, autonegotiation, NIC features, and driver-specific hardware statistics.
- nstat Manual Page Reference for inspecting Linux kernel network and SNMP counters during protocol and packet-loss troubleshooting.
-
sar Manual Page
Documentation for network reports including
DEV,EDEV, andSOFTstatistics used to investigate interface errors, packet rates, softnet drops, and processing backlog. -
ping Manual Page
Reference for ICMP testing, packet payload size,
interface selection, and Path MTU Discovery options such
as
-M do. - MTR Manual Upstream documentation for report mode, repeated path measurements, TCP probing, packet-loss reporting, and MTR output options.
- tcpdump Manual Page Reference for capturing and filtering packets directly from Linux network interfaces during endpoint and path troubleshooting.
