

Linux swap usage can sometimes look confusing, especially when a server still has several gigabytes of available memory. At first glance, this may seem like a sign of memory pressure or poor system performance.
In reality, Linux memory management is designed to use RAM efficiently rather than keep swap permanently at zero. The kernel may move inactive pages to swap even when physical memory is still available.
Understanding Linux swap usage requires looking beyond the amount of free memory. Swap activity, available RAM, page faults, workload behavior, and kernel settings provide a much clearer picture of what is actually happening.
Why Free Memory Does Not Mean Unused Memory
Linux tries to use RAM efficiently. Memory that is not required by active applications is frequently used for page cache, filesystem metadata, buffers, and other kernel structures.
For this reason, the free command can be misleading if you only look at the free column:
free -hExample:
               total        used        free      shared  buff/cache   available
Mem:            31Gi        12Gi       2.5Gi       820Mi        16Gi        17Gi
Swap:          8.0Gi       1.4Gi       6.6Gi
The more important field is available. Here, Linux estimates that about 17 GiB can be used by new applications without heavy swapping.
The swap usage of 1.4 GiB therefore does not automatically indicate a current memory shortage.
Some pages may have been swapped out earlier and simply remained there because the kernel has had no reason to bring them back into RAM.
Swap Usage and Swap Activity Are Different
One of the most important distinctions during troubleshooting is the difference between swap usage and active swapping. A system can show swap space in use while performing no current swap I/O.
Check this with:
vmstat 1 10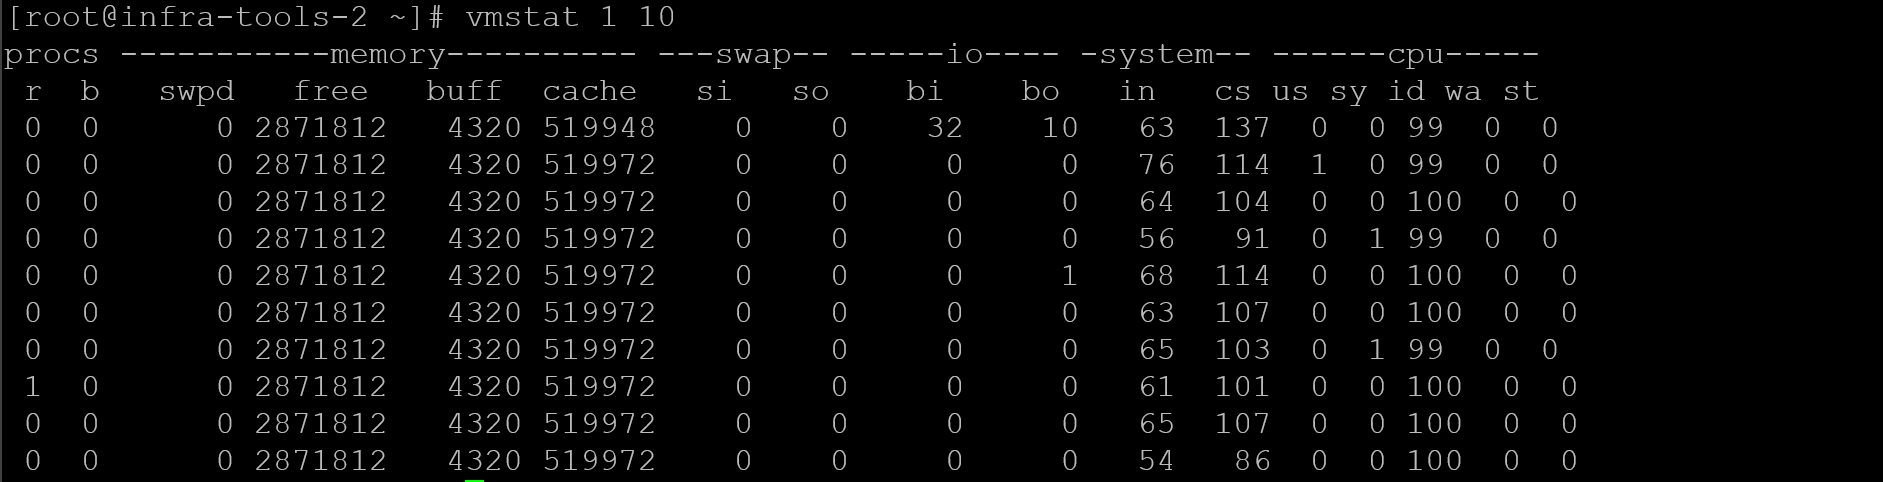
The most useful columns are:
si– Amount of memory being read from swap per second.so– Amount of memory being written to swap per second.free– Currently unused physical memory.buffandcache– Memory used by buffers and filesystem cache.
Important: With vmstat 1 10, the first report contains statistics averaged since the last boot. Use the subsequent samples to evaluate current swap activity.
Example:
procs -----------memory---------- ---swap-- -----io---- -system-- ------cpu-----
 r  b   swpd   free   buff  cache   si   so    bi    bo   in   cs us sy id wa
 1  0 1452800 2600000 210000 9500000  0    0     2     8  700 1300  2  1 97  0
Here, about 1.4 GB of swap is allocated, but both si and so are zero. This means the server is not actively moving pages between RAM and swap at that moment.
💡 That is very different from seeing continuous values in si and so, which can indicate active memory pressure.
Why Linux May Swap Pages Before RAM Is Full
The Linux kernel does not wait until every last megabyte of RAM is consumed before considering swap. Linux balances active application memory, filesystem cache, reclaimable pages, and protection against sudden memory exhaustion.
If the kernel identifies anonymous pages that have not been touched for some time, it may move them to swap and use the released RAM for cache or more active workloads. A rarely accessed application page may provide less value in RAM than filesystem cache being read repeatedly.
This behavior is influenced partly by the vm.swappiness parameter. Check it with:
sysctl vm.swappinessor:
cat /proc/sys/vm/swappinessA common default is 60, although values vary by distribution and workload. Higher values make the kernel more willing to swap anonymous memory; lower values make it favor other reclaim paths first. A low value does not disable swap.
Swapped Pages Can Stay in Swap for a Long Time
Suppose a server experienced a memory spike overnight. During the event, some inactive pages were moved to swap. Later, the workload dropped and several gigabytes of RAM became available again.
Linux does not automatically read all those swapped pages back into RAM just because memory became free. Doing so would create unnecessary disk I/O. The pages are usually brought back only when a process accesses them again.
This explains a common situation:
MemAvailable:  12000000 kB
SwapTotal:      8388604 kB
SwapFree:       6500000 kB
The server may currently have plenty of available RAM while still showing almost 2 GB of historical swap usage. If swap-in and swap-out activity is near zero, this is often harmless.
Check Current Memory Pressure with /proc/meminfo
For a more detailed view, inspect:
cat /proc/meminfoImportant fields include:
MemTotal
MemFree
MemAvailable
Buffers
Cached
SwapCached
SwapTotal
SwapFree
Active
Inactive
Active(anon)
Inactive(anon)
Active(file)
Inactive(file)
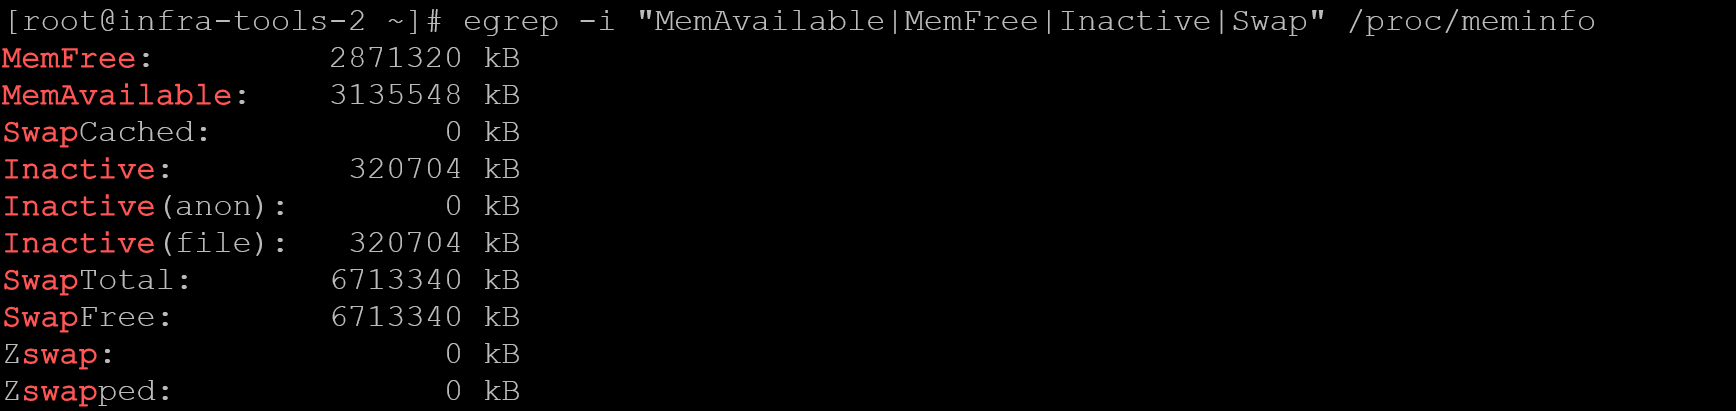
MemAvailable is generally more useful than MemFree. Inactive(anon) is also useful context because it represents anonymous memory currently classified as inactive. However, it should not be interpreted as the amount of memory that Linux will necessarily move to swap:
egrep -i "MemAvailable|MemFree|Inactive|Swap" /proc/meminfoExample:
Use sar to Check Historical Swap Activity
A server may look healthy when you log in even though it experienced memory pressure or active swapping earlier.
If sysstat is installed and historical data collection is enabled, you can review previous swap activity with:
sar -WFor a real-time sample that does not depend on previously collected data, use:
sar -W 1 10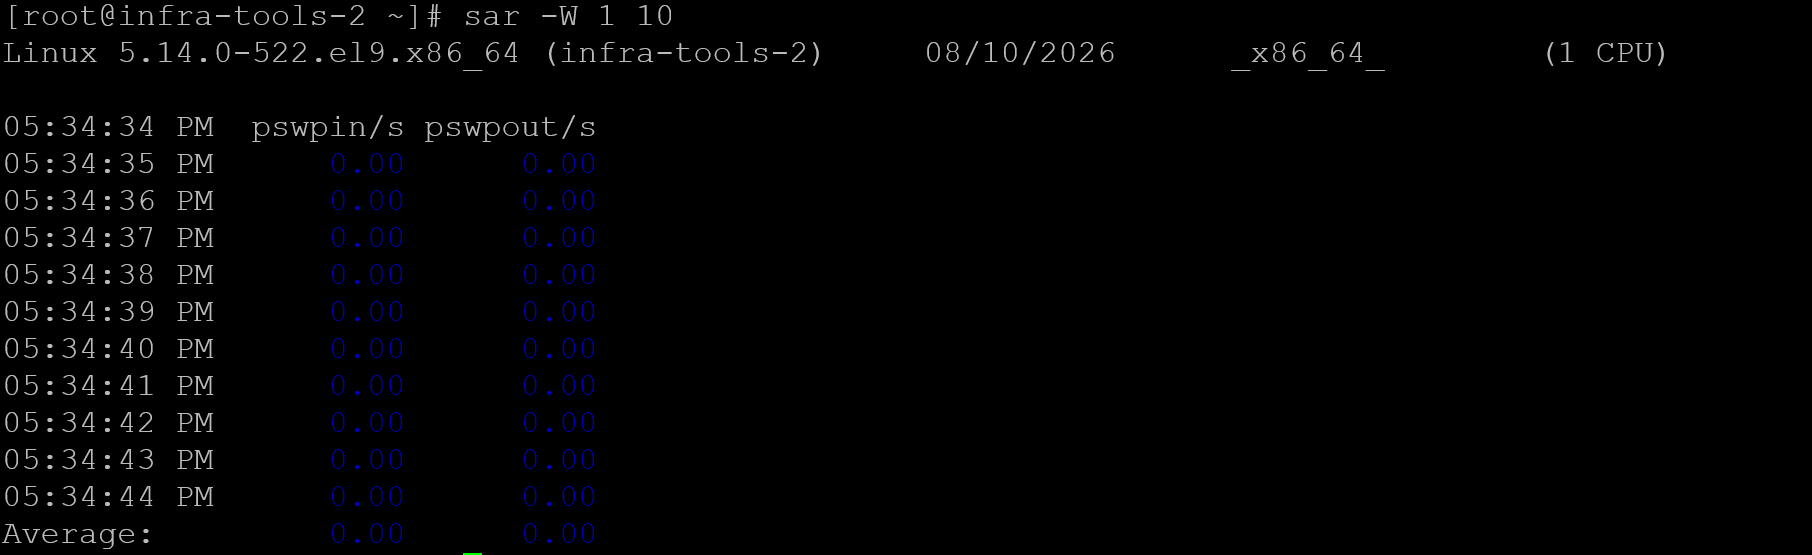
The most useful fields are:
pswpin/s: pages being read from swap back into RAM per second.pswpout/s: pages being written from RAM to swap per second.
Memory statistics can also be sampled in real time with:
sar -r 1 10If running sar -W or sar -r without an interval returns an error such as:
Cannot open /var/log/sa/sa10: No such file or directory
Please check if data collecting is enabled
the system does not yet have a historical sysstat data file for that day. In that situation, either use real-time sampling or enable the sysstat collection service and timers for future analysis.
Historical data is especially useful because current swap usage alone cannot tell you when those pages were moved to swap. A spike during a backup, batch job, application restart, or database maintenance window may explain why swap remains allocated even though the server currently has plenty of available memory.
Enable sysstat Historical Data Collection
If sar returns an error such as:
Cannot open /var/log/sa/sa10: No such file or directory
Please check if data collecting is enabled
the sysstat package may be installed, but periodic data collection is not yet enabled.
On RHEL-based distributions such as RHEL, Rocky Linux, and AlmaLinux, start by enabling the main sysstat service:
systemctl enable --now sysstatThen check whether the collection timers are active:
systemctl status sysstat-collect.timer
systemctl status sysstat-summary.timer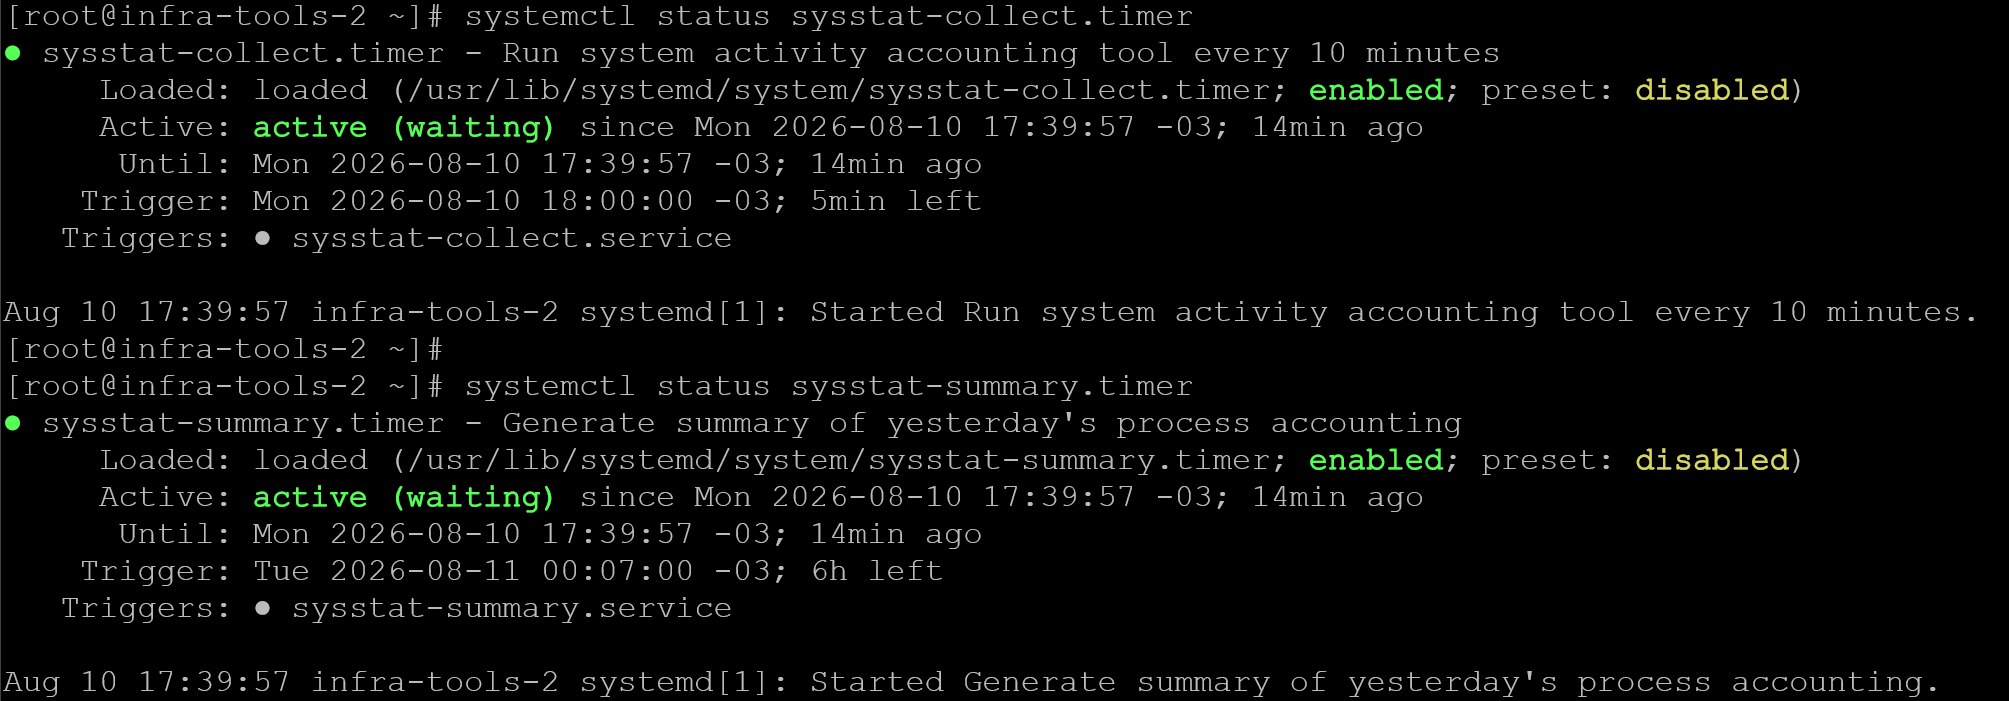
If they are disabled, enable them with:
systemctl enable --now sysstat-collect.timer
systemctl enable --now sysstat-summary.timer
You can confirm that the timers are scheduled with:
systemctl list-timers | grep sysstat
After the collector runs, daily statistics files should begin to appear under:
ls -lh /var/log/sa/
Typical files include entries such as:
sa10
sar10
The saXX file stores the binary performance data for that day, while the corresponding sarXX file may contain the daily summary.
Once data collection is active, commands such as:
sar -W
sar -r
can read historical swap and memory statistics instead of returning the missing-file error:
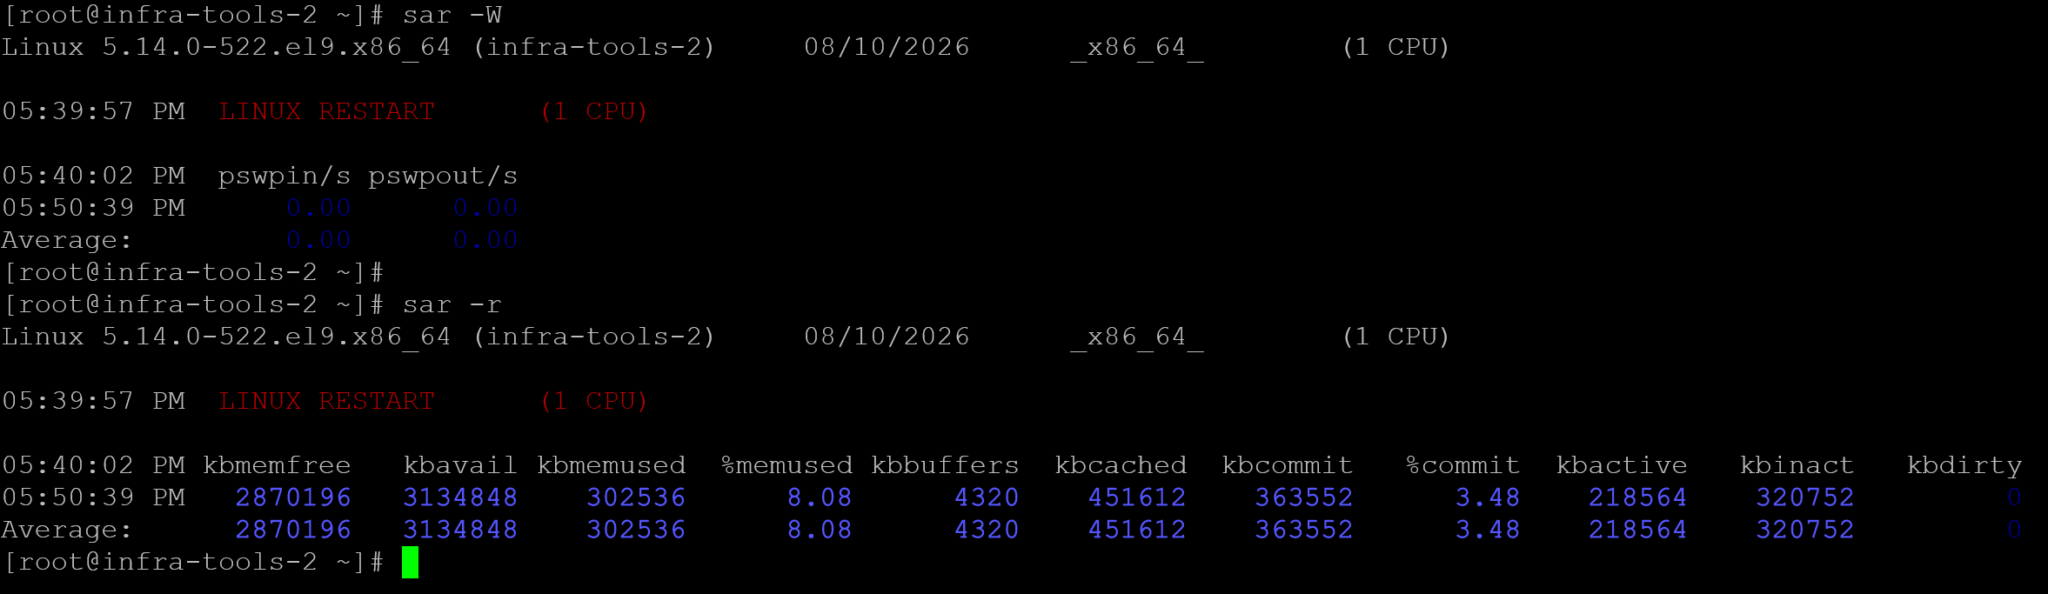
Important: Keep in mind that enabling sysstat does not create past data retroactively. Historical information becomes available only after the collector has started running. For immediate troubleshooting, you can still use real-time sampling:
sar -W 1 10
sar -r 1 10
Find Which Processes Are Using Swap
To determine whether one application is responsible for most swap usage, you can inspect /proc.
One practical command is:
for pid in /proc/[0-9]*; do
    awk '/VmSwap/{if ($2 > 0) print FILENAME, $2 " kB"}' "$pid/status" 2>/dev/null
done | sort -k2 -n
Another useful option is smem, which can report memory usage per process and help identify applications with pages stored in swap.
If it is already installed, run:
smem -rs swapThis sorts processes by swap usage, making it easier to identify applications that have accumulated significant swapped memory.
On RHEL-based systems, however, smem may not be installed by default. If the command returns:
-bash: smem: command not foundfirst check whether the package is available:
dnf search smemOn RHEL, Rocky Linux, and AlmaLinux, smem is commonly provided through the EPEL repository.
If EPEL is already enabled, install it with:
dnf install smemIf the package is not found, you may need to enable EPEL first. On RHEL 8, for example:
dnf install https://dl.fedoraproject.org/pub/epel/epel-release-latest-8.noarch.rpmThen install smem:
dnf install smemAfter installation, run:
smem -rs swapFor example:
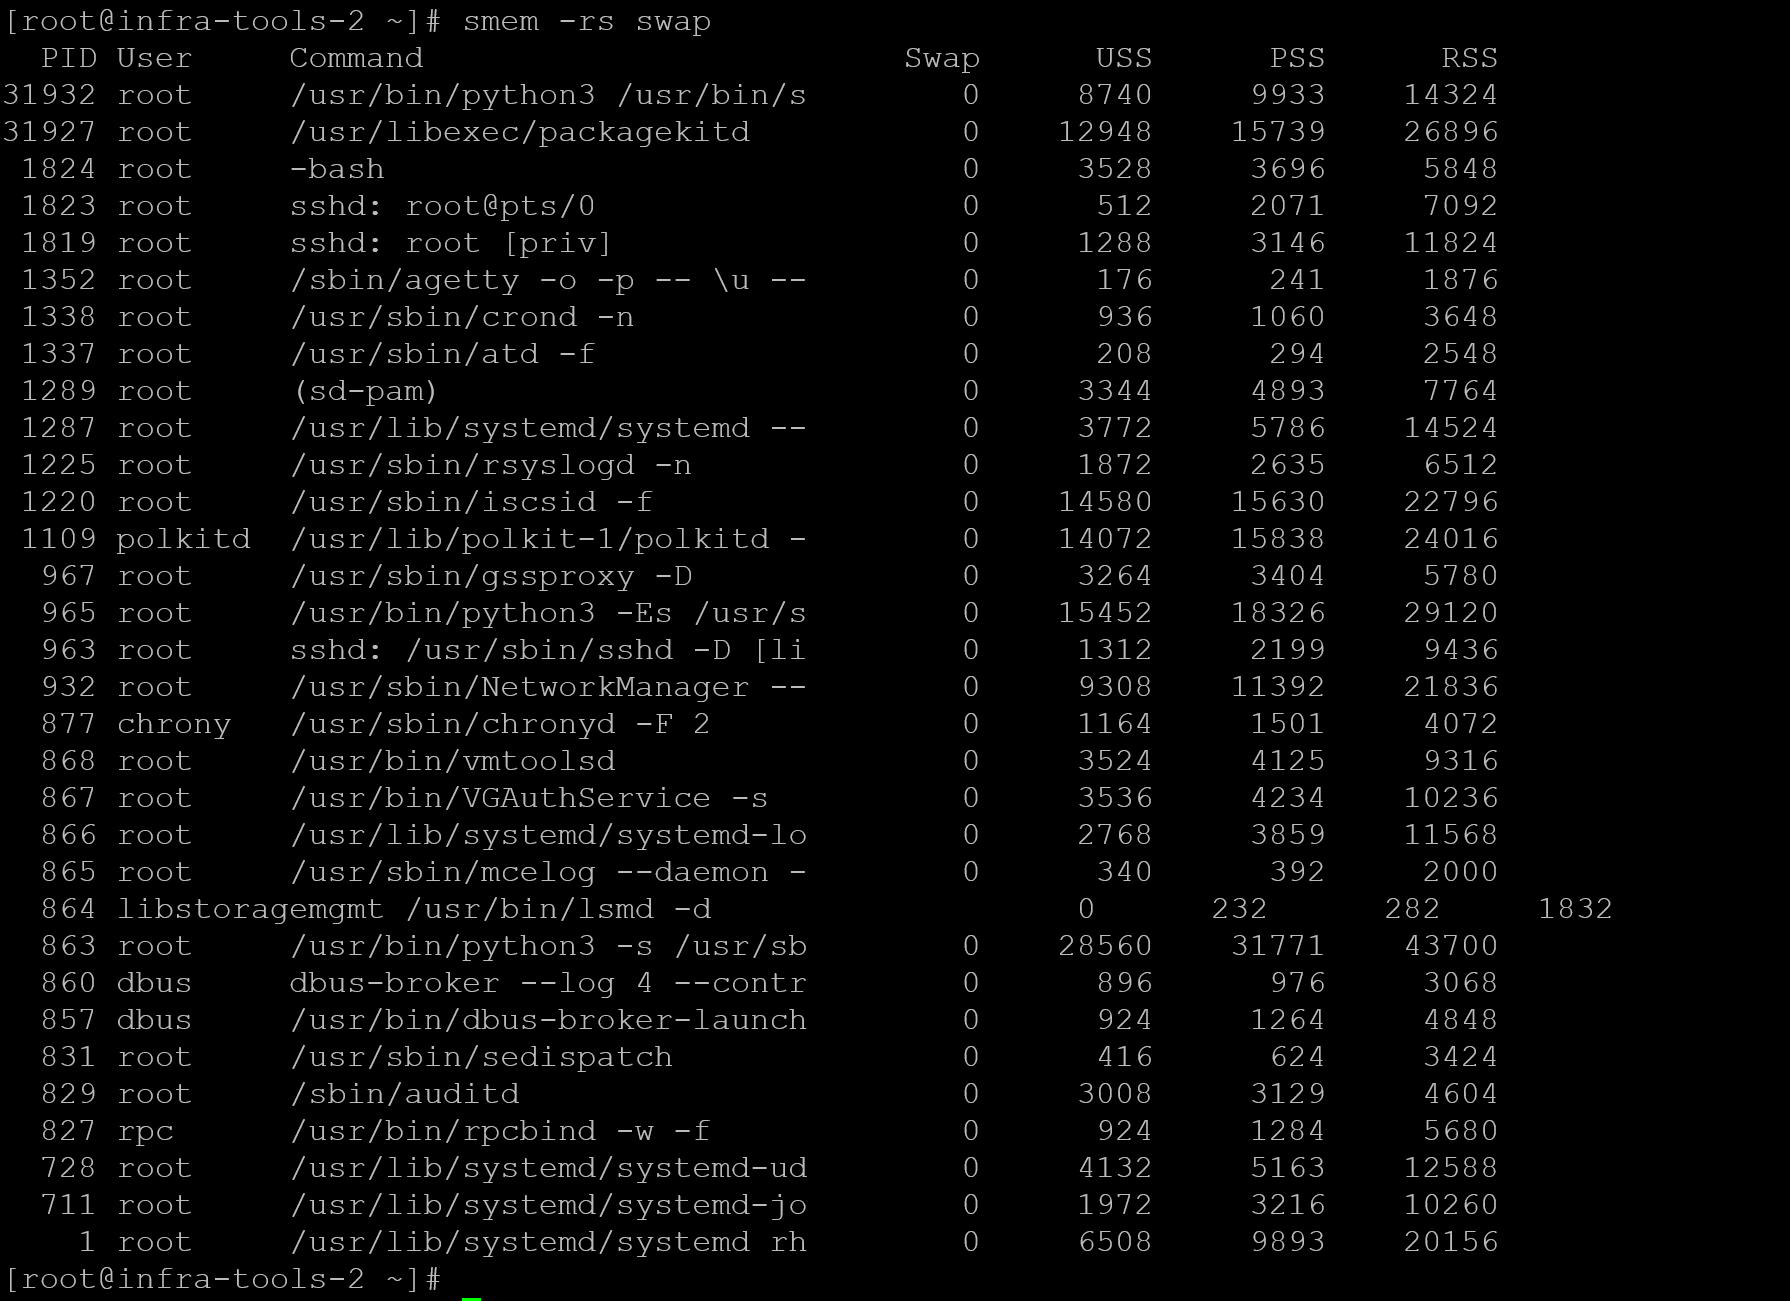
A system with several processes using swap does not necessarily have a current memory problem. The output should still be correlated with tools such as vmstat, especially the si and so columns, to determine whether active swapping is occurring.
💡 Important: A process using swap is not necessarily unhealthy. The important question is whether accessing that process causes latency or repeated swap-in activity.
If the investigation shows that a specific process is consuming an unusual amount of memory, see “Linux Process Resource Usage: How to Find Heavy Processes“ for a broader CPU, memory, disk, and network analysis.
Check for Major Page Faults
When a process accesses a page that is no longer in physical memory, a page fault occurs. Minor page faults are normal and do not require disk access. Major page faults are more expensive because the page must be retrieved from storage.
You can observe process-level faults with:
pidstat -r 1Useful columns include memory usage and major faults per second.
A high majflt/s rate means that the process is frequently waiting for memory pages that must be loaded from storage.
Some of those faults may involve pages being retrieved from swap, but major page faults can also involve file-backed pages that are not currently resident in memory.
For this reason, correlate majflt/s with vmstat si/so, swap usage, application latency, and storage activity before concluding that swap is responsible for the page faults.
Storage Performance Still Matters
Swap is much slower than RAM, so the performance impact depends heavily on the underlying storage.
Check block device latency with:
iostat -xz 1 10Pay attention to fields such as:
await
r_await
w_await
%util
⚠️ If active swapping coincides with high storage latency, the effect can be significant. For this reason, memory and storage metrics should be evaluated together.
Note: %util should not be interpreted as a universal storage saturation indicator. Values close to 100% are particularly meaningful for devices that serve requests serially, but modern SSDs, RAID arrays, SAN-backed devices, and other parallel storage systems can process multiple operations concurrently. In those environments, correlate %util with latency, queue depth, throughput, and application behavior.
Verify Whether the System Is Under Real Pressure
A healthy server with some swap usage often has this pattern:
MemAvailable: high
swap used: nonzero
vmstat si: 0
vmstat so: 0
major faults: low
disk latency: normal
A server under active memory pressure looks different:
MemAvailable: low or falling
swap used: increasing
vmstat si/so: continuous
major faults: increasing
disk latency: elevated
application response time: degraded
The second pattern deserves investigation for memory leaks, application heap growth, unexpected workloads, or insufficient RAM.
Be Careful with swapoff
Administrators sometimes try to “fix” swap usage by running:
swapoff -a
swapon -a
This forces swapped pages back into RAM.
It can make swap usage return to zero, but it does not solve the reason those pages were swapped in the first place.
swapoff requires enough memory to accommodate the pages that must be brought back from swap. If sufficient memory cannot be made available, the operation can fail. On an already memory-constrained server, attempting to eliminate swap can also increase memory pressure and raise the risk of OOM conditions.
Use it only when you understand the memory headroom and have a valid operational reason.
Should You Lower vm.swappiness?
The vm.swappiness parameter influences how the Linux kernel balances reclaiming file-backed memory, such as page cache, against moving anonymous memory pages to swap.
Check the current value with:
sysctl vm.swappinessA typical RHEL system may return:
vm.swappiness = 60Note: The supported swappiness range can depend on the kernel and distribution. Current upstream Linux kernel documentation defines values from 0 to 200, while Red Hat documentation commonly describes RHEL tuning within the 0–100 range. Always check the documentation for the operating system being tuned.
It is important to understand that a value of 60 does not mean Linux will start swapping when RAM reaches 60% utilization. Swappiness is a relative preference used by the kernel during memory reclaim.
In practical terms, a higher value makes the kernel more willing to reclaim anonymous memory by moving inactive pages to swap, potentially preserving more filesystem cache in RAM. A lower value makes the kernel less willing to swap anonymous pages and generally favors reclaiming file-backed cache first.
For example:
sysctl -w vm.swappiness=10changes the value immediately, but only until the next reboot.
To make the setting persistent, create a sysctl configuration file such as:
vi /etc/sysctl.d/99-swappiness.confand add:
vm.swappiness = 10Then apply the configuration:
sysctl --systemA lower value such as 10 is sometimes appropriate for workloads where keeping application memory in RAM is particularly important, including some database, virtualization, and latency-sensitive environments.
However, lowering swappiness should not be treated as a general fix for swap usage.
For example, consider a server showing:
MemAvailable:  12 GB
SwapUsed:       2 GB
vmstat si:      0
vmstat so:      0
In this situation, changing vm.swappiness may provide little benefit. The 2 GB of swap could simply contain inactive pages moved there during an earlier period of memory pressure.
A different situation would be:
MemAvailable:  500 MB
SwapUsed:       increasing
vmstat si:      continuous activity
vmstat so:      continuous activity
Here, the system is experiencing real memory pressure. Reducing swappiness may change how aggressively the kernel uses swap, but it does not solve the underlying shortage of physical memory.
Be particularly careful with:
sysctl -w vm.swappiness=0Setting swappiness to zero does not simply “disable unnecessary swapping.” It makes the kernel aggressively avoid swapping anonymous memory and can increase the risk of processes being terminated by the OOM killer when the system experiences heavy memory pressure.
For production systems, a better approach is to first determine whether active swapping is actually causing a performance problem. Check vmstat, sar, major page faults, memory availability, and application latency before modifying this parameter.
If tuning is justified, change the value gradually, monitor the workload, and follow application or vendor recommendations rather than selecting a low value simply because swap space is being used.

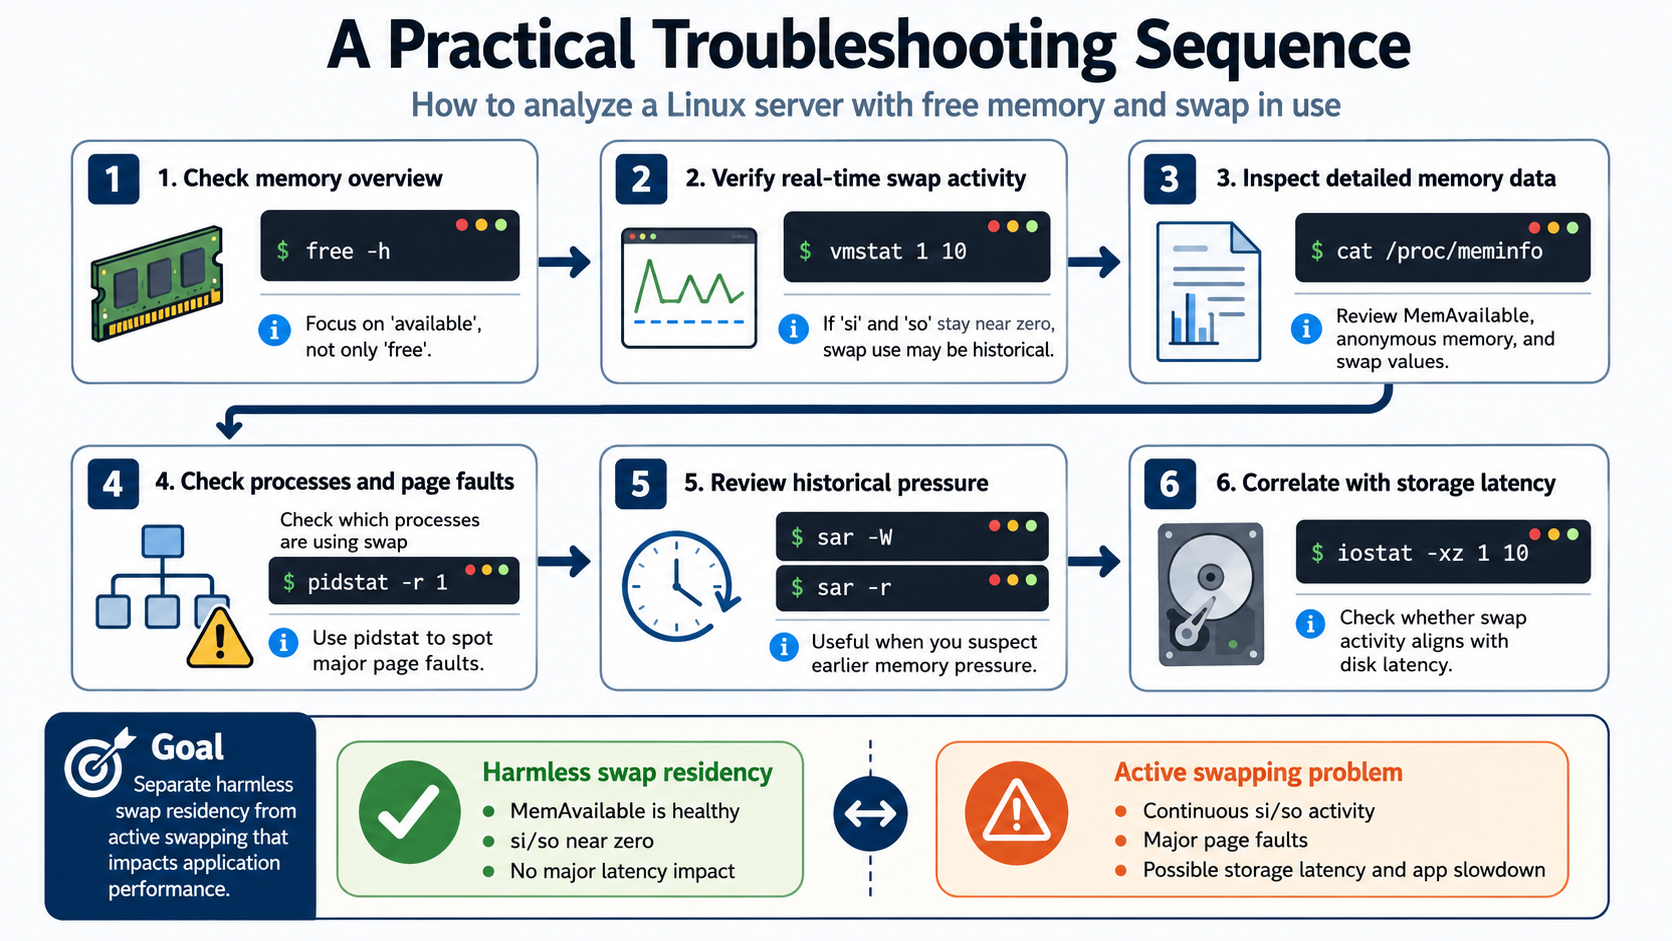
A Practical Troubleshooting Sequence
When you find a server with free memory and swap in use, start with:
free -hCheck available, not only free.
Then verify real-time swap activity:
vmstat 1 10If si and so remain near zero, the swap usage may be historical.
Next, inspect:
cat /proc/meminfoLook at MemAvailable, anonymous memory, and swap values.
Check which processes are using swap, then use:
pidstat -r 1to identify major page faults.
If you suspect earlier pressure, review historical data with:
sar -W
sar -r
Finally, correlate memory behavior with storage latency using:
iostat -xz 1 10This sequence helps separate harmless swap residency from active swapping that affects application performance.
Key Takeaways
A Linux server does not need to keep swap at zero to be healthy. What matters is whether the kernel is actively moving pages, whether applications are suffering major page faults, and whether storage latency is amplifying the effect.
In many cases, free memory and used swap can coexist for hours or even days without indicating a problem. Once you focus on swap activity instead of the swap total alone, the behavior becomes much easier to interpret and troubleshoot.
External References
-
Linux Kernel — Virtual Memory Sysctl Documentation
Official Linux kernel documentation for virtual memory parameters,
including
vm.swappiness, reclaim behavior, and memory management tuning. -
Linux Kernel — /proc Filesystem Documentation
Kernel reference for memory statistics exposed through
/proc, including/proc/meminfo, active and inactive memory, cache, and swap-related counters. -
free — Display Amount of Free and Used Memory
Linux manual page explaining the
freecommand, including the meaning of free, available, cache, buffers, and swap memory. -
vmstat — Virtual Memory Statistics
Official manual page for
vmstat, including swap-in and swap-out activity, memory counters, CPU statistics, and sampling behavior. - pidstat — Process Performance Statistics Reference for monitoring per-process resource usage, including minor and major page faults that can help correlate application behavior with memory and storage activity.
-
sar — Collect and Report System Activity
Documentation for analyzing historical Linux performance data,
including swap activity with
sar -Wand memory utilization withsar -r. - iostat — CPU and Device I/O Statistics Reference for investigating storage latency, utilization, queue behavior, throughput, and I/O performance when memory pressure may be affecting disk activity.
-
Red Hat Enterprise Linux — Configuring Memory Access
Red Hat guidance for memory-management tuning on RHEL,
including
vm.swappiness, memory reclaim, workload behavior, and related performance considerations.
