

The PowerFlex command-line interface (SCLI) gives administrators a direct way to inspect cluster roles, storage resources, device health, volume mappings, and performance counters. This guide collects practical SCLI commands for PowerFlex 4.5.x and explains what each query does—and what its output does not prove.
The examples use a PowerFlex 4.5.2 lab. Names, IP addresses, resource counts, device paths, and reported states are specific to that environment. Replace them with values from your own cluster, and verify every command against the CLI reference for the installed release before using it in automation or production operations.
If you are new to PowerFlex, start with Getting Started with Dell PowerFlex: Architecture and Key Components, which explains the roles of the MDM, SDS, SDC, and other components referenced throughout these SCLI examples.
Accessing SCLI
Dell documents SCLI as part of the MDM component. The PowerFlex 4.5.x CLI reference lists scli for Linux and VMware and siocli for Citrix Hypervisor (XenServer). The reference lists command names rather than a universal executable path, so use the location appropriate to the installed package and operating system.
Before running most commands, authenticate to the PowerFlex management system. The management-system address is the reachable management endpoint for the deployment; it is not necessarily the IP address of the MDM whose role is Primary. Omit the password from the command line so SCLI prompts for it instead of exposing it in shell history:
scli --login --management_system_ip <PFMP_INGRESS_IP_OR_DNS> --username <USERNAME>For example, if pfmp.lab.local resolves to the management endpoint and the account is named admin:
scli --login --management_system_ip pfmp.lab.local --username adminThe CLI session remains authenticated until the user logs out or the session expires. On first use, follow Dell’s release-specific instructions for trusting the management certificate. Use the exact CA filename present on the system; do not copy a malformed command copied from an extracted manual page.
Direct commands to the Primary MDM
SCLI commands operate against an MDM. When SCLI runs on the Primary MDM, the --mdm_ip option may be omitted. If SCLI runs on a Secondary MDM or on a separate host, specify the current Primary MDM address with --mdm_ip on each command:
scli --mdm_ip <PRIMARY_MDM_IP> --query_cluster
scli --mdm_ip <PRIMARY_MDM_IP> --query_all_sdsNote: A command run from a Secondary MDM without targeting the Primary is not supported. Therefore, replace the draft’s broad statement that commands fail simply because the shell is not on the Primary: the shell can be elsewhere, provided the command is directed to the current Primary as Dell documents.


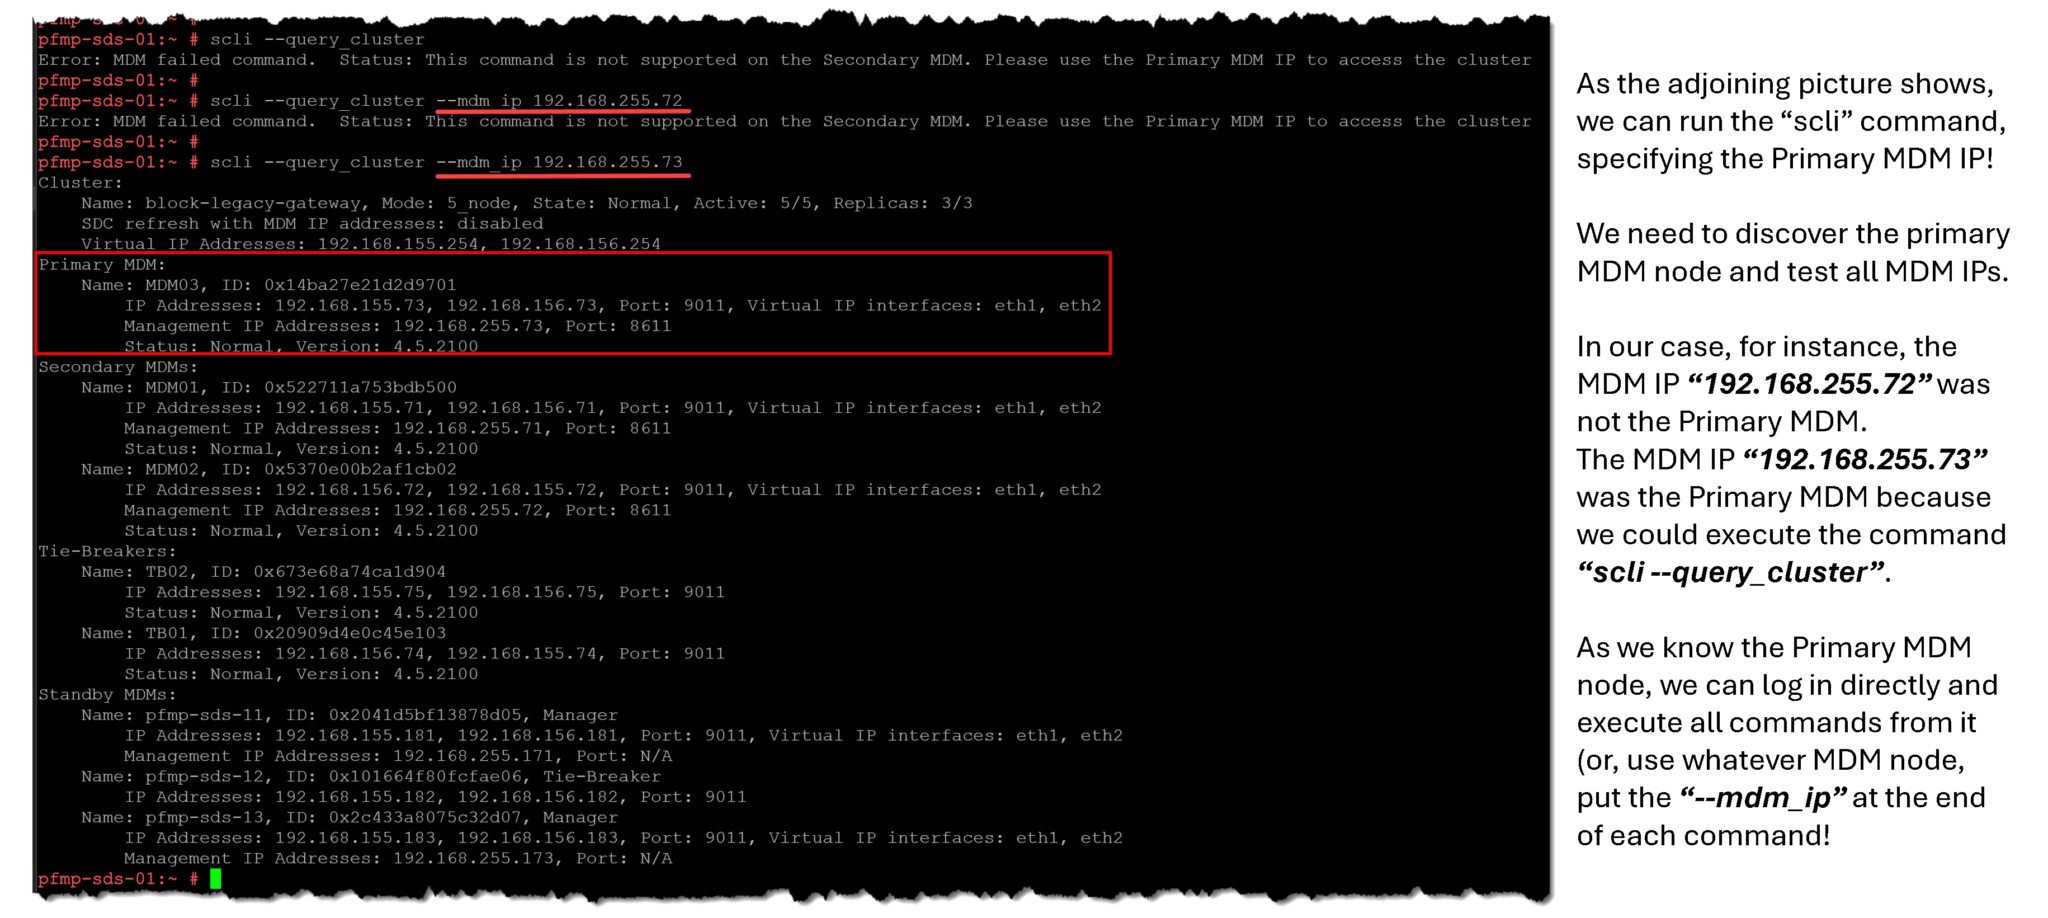
As showed you before, our Primary MDM is the “SDS03”. To switch the Primary MDM ownership to another MDM, we can execute the following command (in this example, we are switching the Primary MDM ownership from SDS03 (192.168.255.73) to SDS01 (192.168.255.71)):
scli --login --management_system_ip pfmp.lab.local --username admin
scli --switch_mdm_ownership --new_primary_mdm_ip 192.168.255.71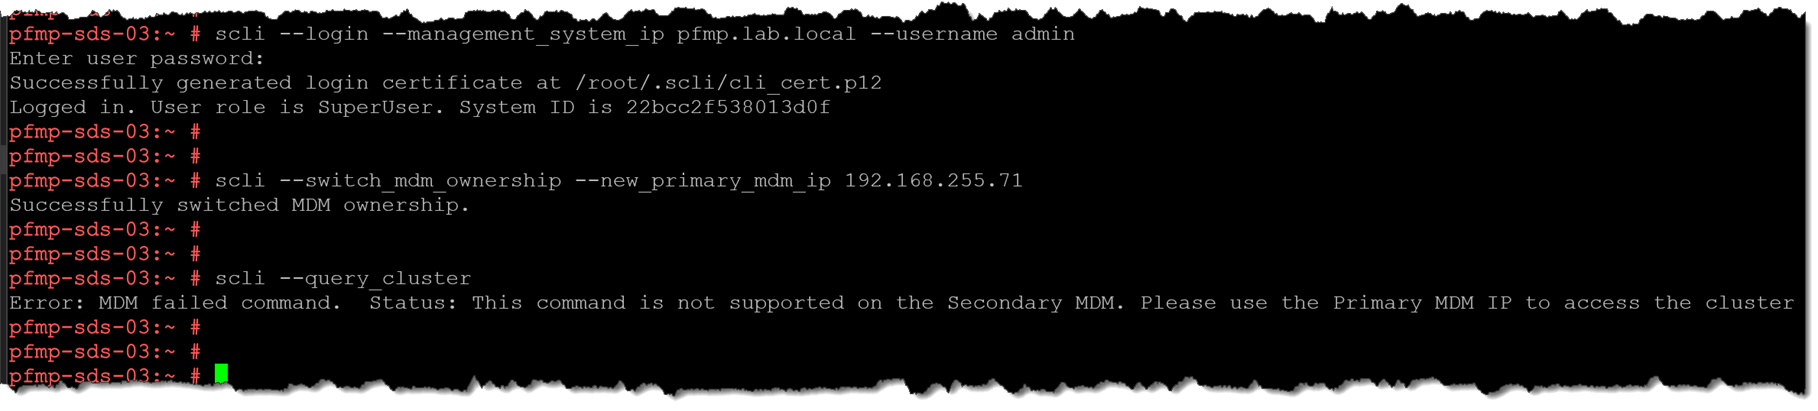
As shown in the above picture, we have switched the Primary MDM ownership from SDS03 to SDS01. We have tried to execute a command from SDS03, and we have received an error since this node is not the Primary MDM node anymore.
The best approach is to log in to SDS01 and run the commands from there!
Querying MDM Cluster Details
To query the MDM Cluster details:
scli --query_cluster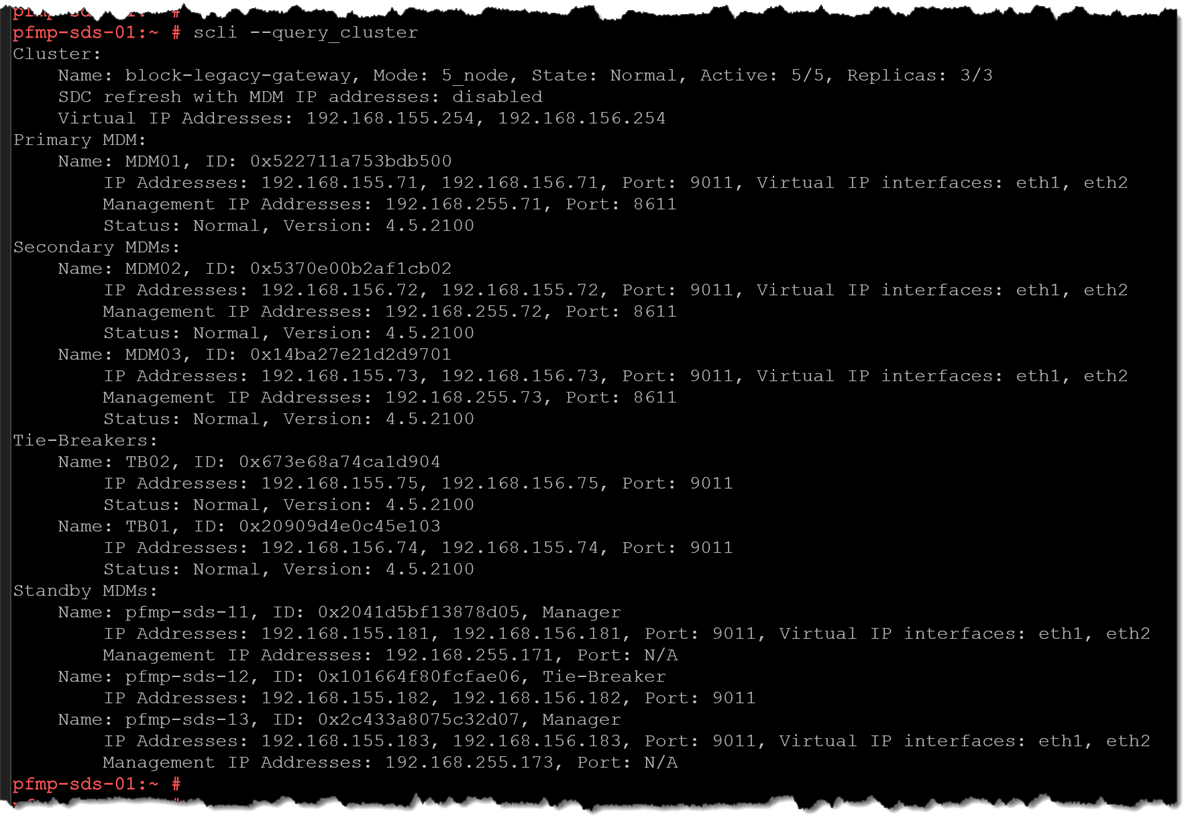
This command helps understand the MDM cluster topology (whether a 3-node or 5-node cluster). Moreover, we can see the following details:
— Virtual IP addresses and their associated interfaces (if in use);
— The Primary MDM node;
— The Secondary MDM node;
— Tie-Breakers nodes;
— Standby MDMs;
— All IP addresses for each MDM node.
Querying Storage Data Server (SDS) Nodes
To query all Storage Data Server (SDS) nodes:
scli --query_all_sds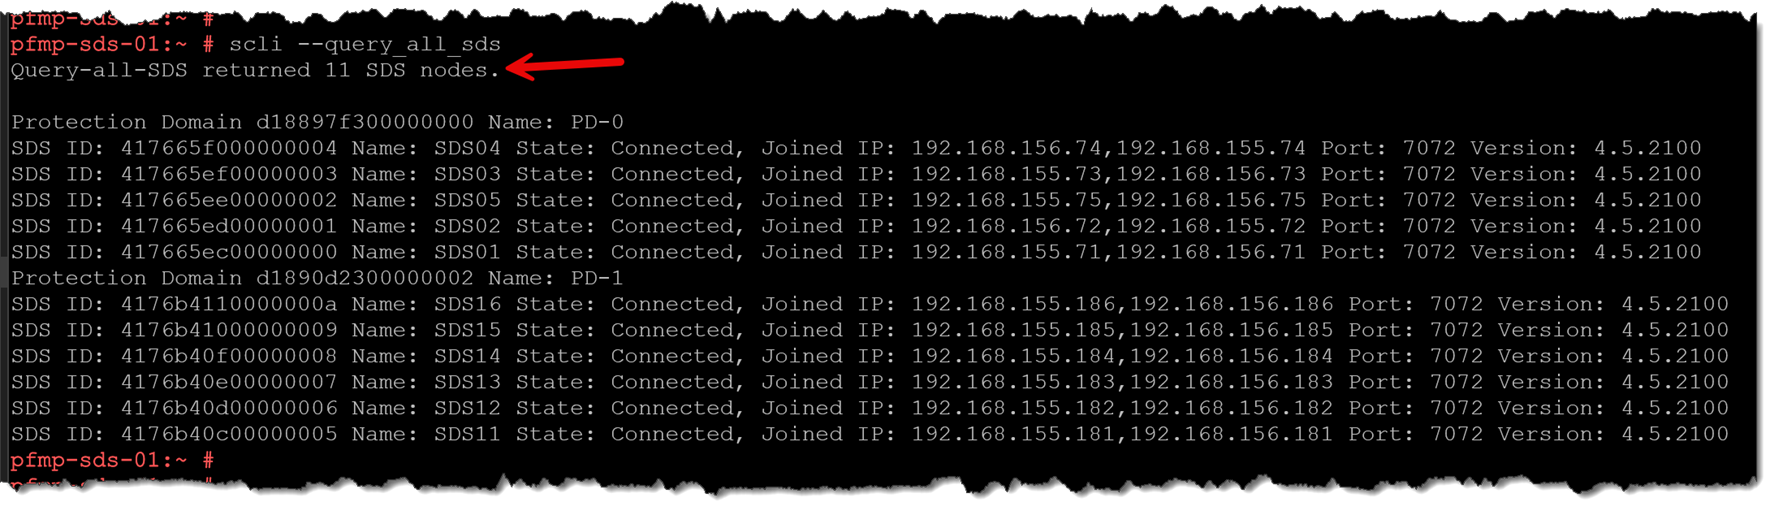
As shown in the above picture, eleven (11) SDS nodes exist, divided into two different Protection Domains (PD-0 and PD-1).
Querying Protection Domain Details
To query details of each Protection Domain:
scli --query_protection_domain --protection_domain_name PD-0
scli --query_protection_domain --protection_domain_name PD-1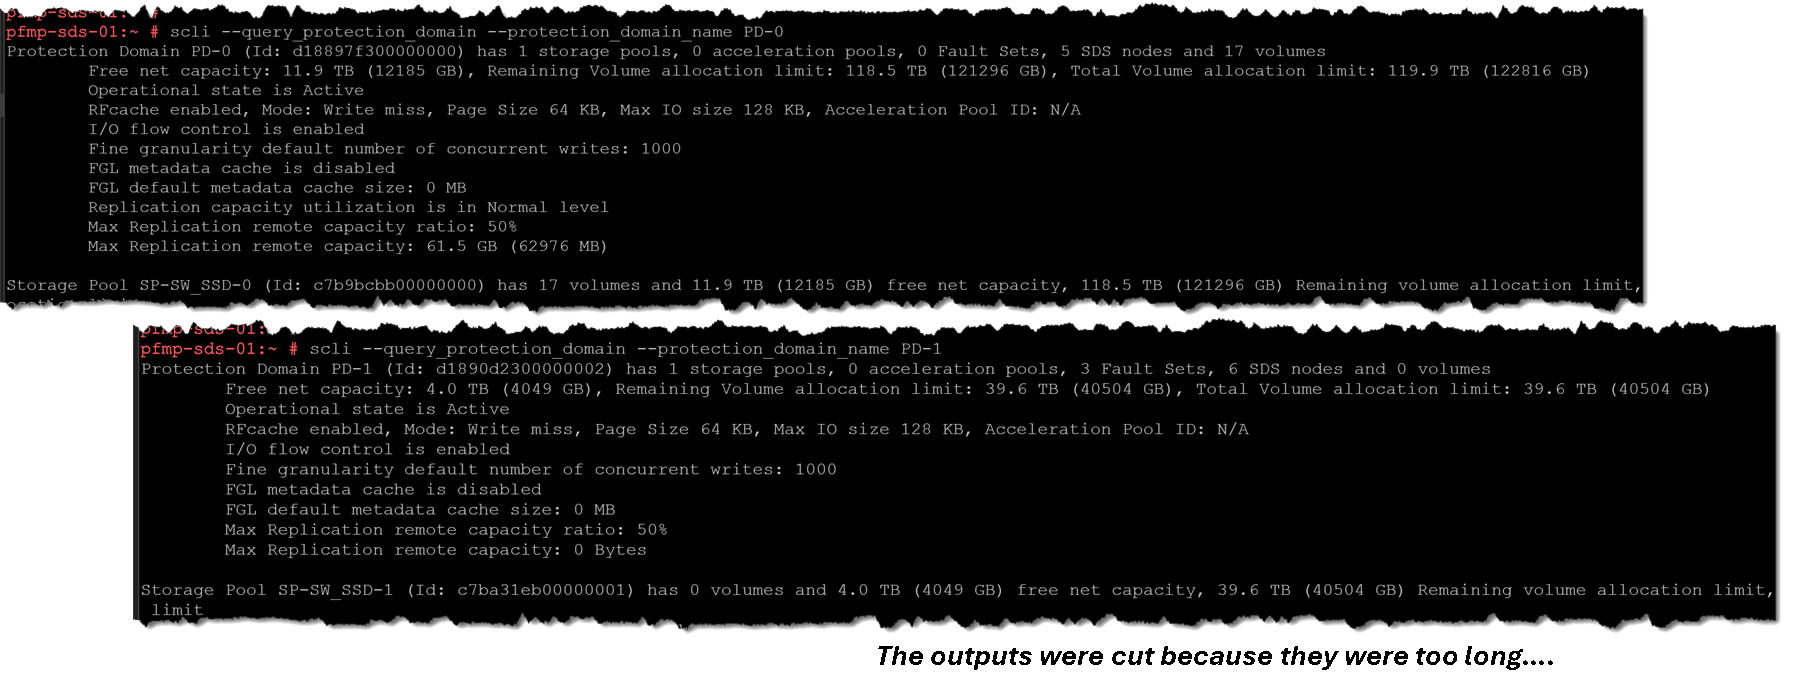
Querying Storage Pool Details
To query a Storage Pool by Protection Domain and pool name, run:
scli --query_storage_pool --protection_domain_name <PD_NAME> --storage_pool_name <SP_NAME>For example:
scli --query_storage_pool --protection_domain_name PD-0 --storage_pool_name SP-SW_SSD-0
scli --query_storage_pool --protection_domain_name PD-1 --storage_pool_name SP-SW_SSD-1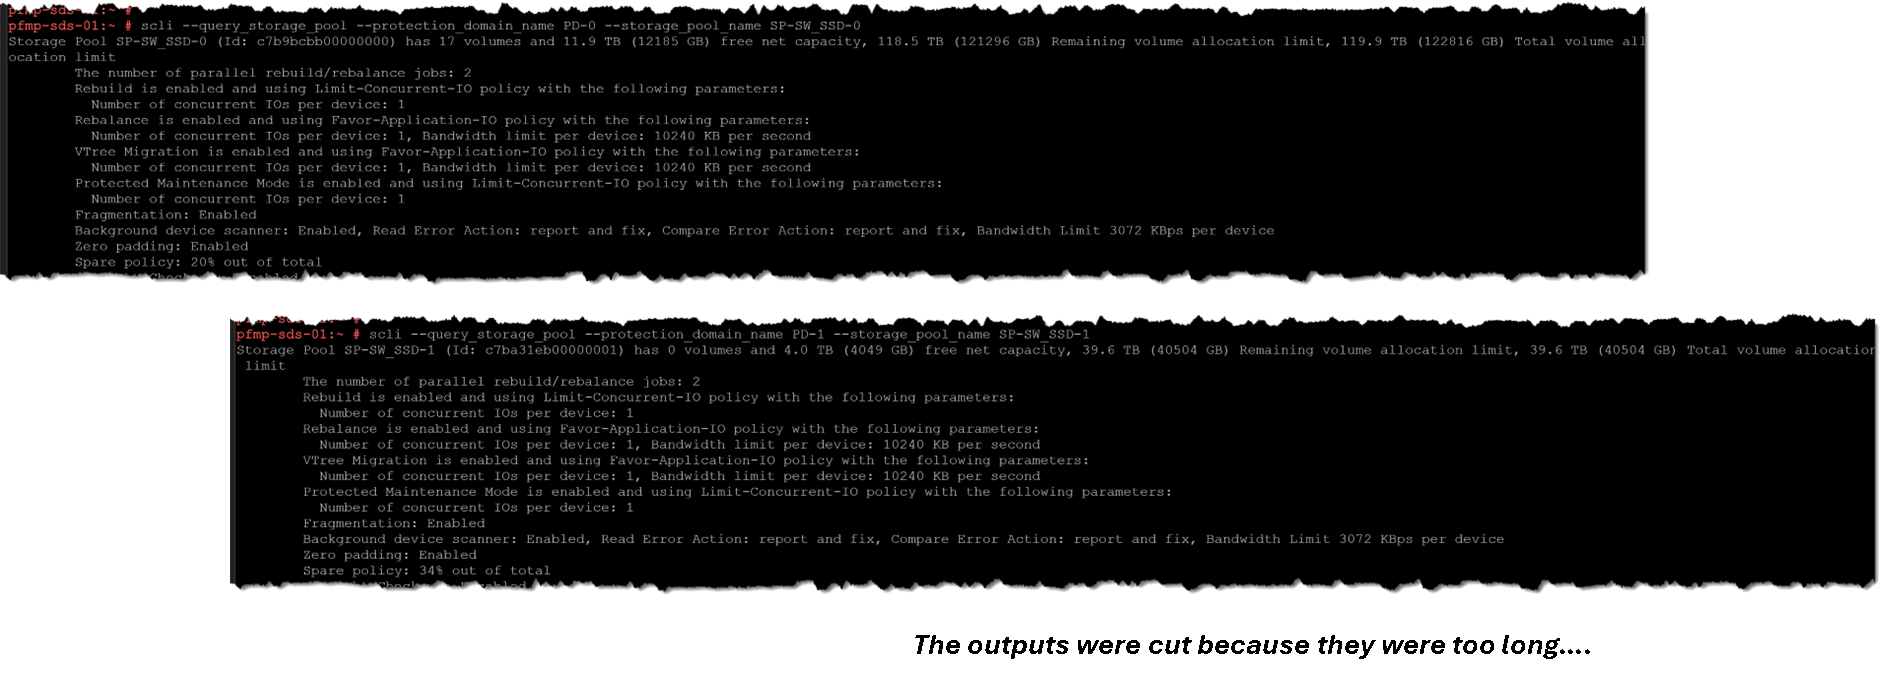
Dell also documents querying by Storage Pool ID. Use names and IDs from the target system rather than copying the lab values.
Querying Storage Data Client (SDC) Nodes
To list registered SDCs, run:
scli --query_all_sdc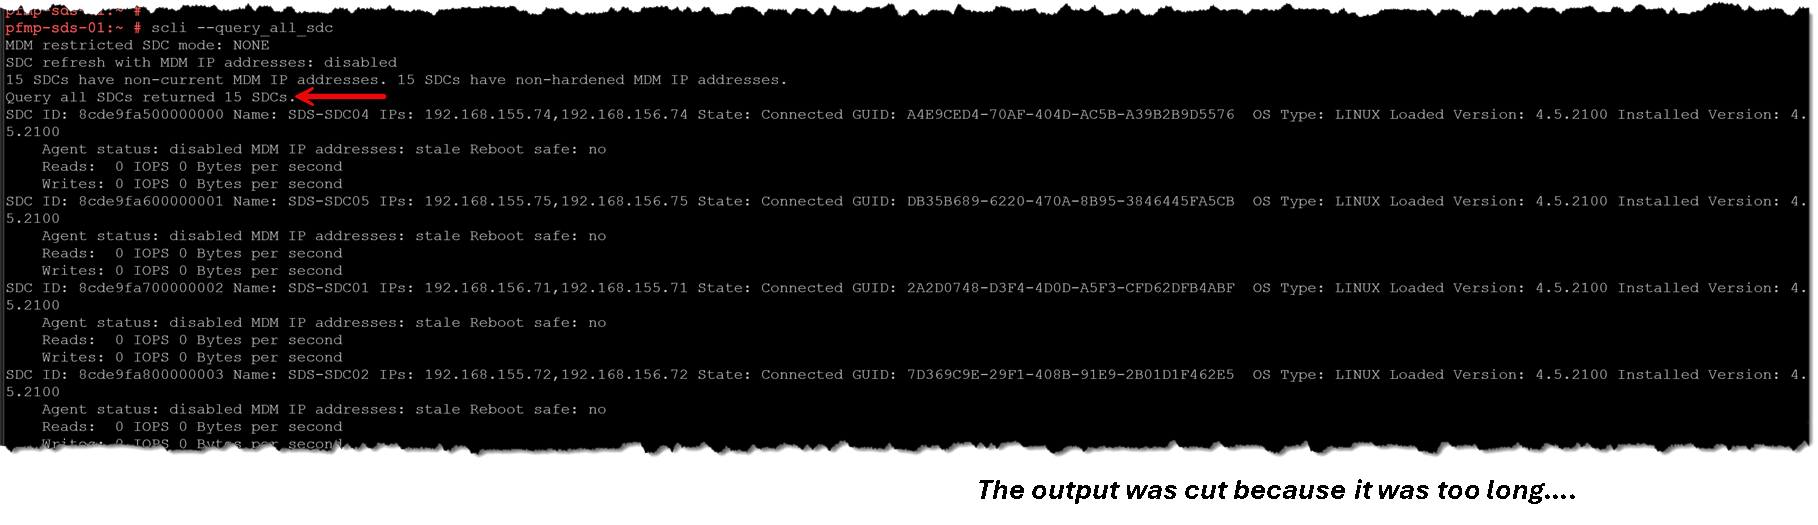
The standard output can include the SDC ID, name, IP address, connection state, GUID, operating-system type, loaded version, installed version, and read/write IOPS and bandwidth. Optional switches can request additional agent-status or MDM-address information, but do not attribute those fields to the default output unless you include and verify the relevant switches.
Use Dell’s labels as printed: State and GUID are separate, and Loaded Version is distinct from Installed Version. A name can also be N/A; the SDC’s GUID is a useful stable identifier when checking which record you intend to manage.
To install an SDC on VMware ESXi, see Connecting VMware ESXi to PowerFlex: A Step-by-Step SDC Installation Guide. To assign a more descriptive PowerFlex-side name to an existing SDC, see Rename PowerFlex SDCs with SCLI for a Clearer ESXi Inventory.
The number of SDCs and the states shown in a screenshot are point-in-time values from the lab. A Connected SDC record does not by itself prove that every SDC-to-SDS data path is healthy. To check current SDC-to-SDS disconnections, Dell documents:
scli --query_sdc_to_sds_disconnectionsQuerying Details of a Specific Storage Data Server (SDS) Nodes
To query details of a specific Storage Data Server (SDS) node:
scli --query_sds --sds_name SDS01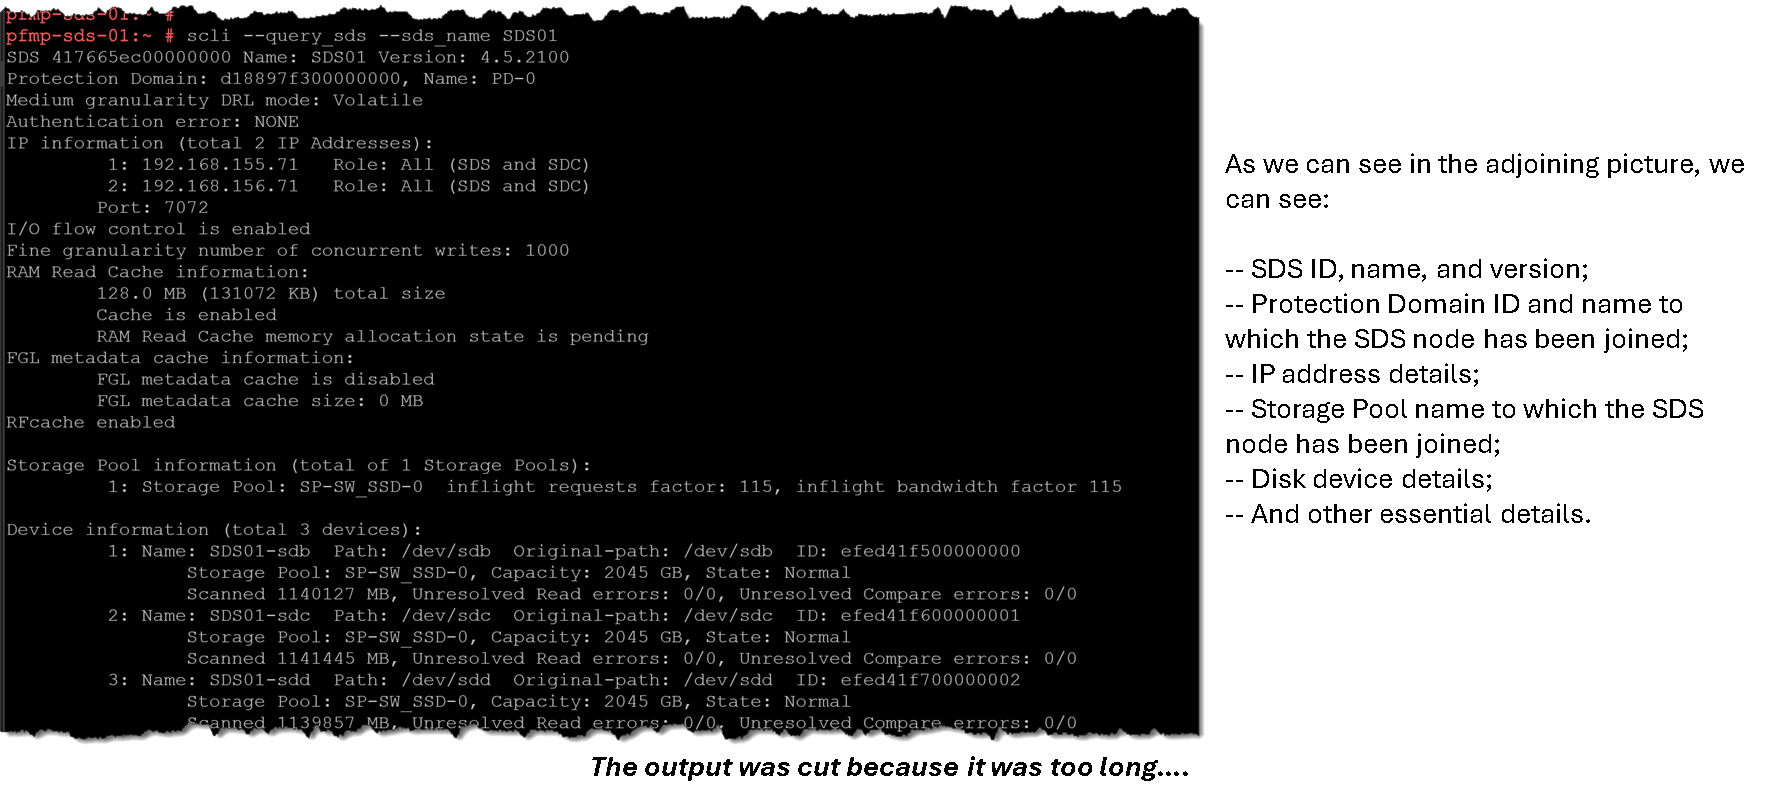
Querying Details of a Specific Disk Device on SDS Node
To query details of a specific disk device for a Storage Data Server (SDS) node:
scli --query_sds_device_info --sds_name SDS01 --device_path /dev/sdc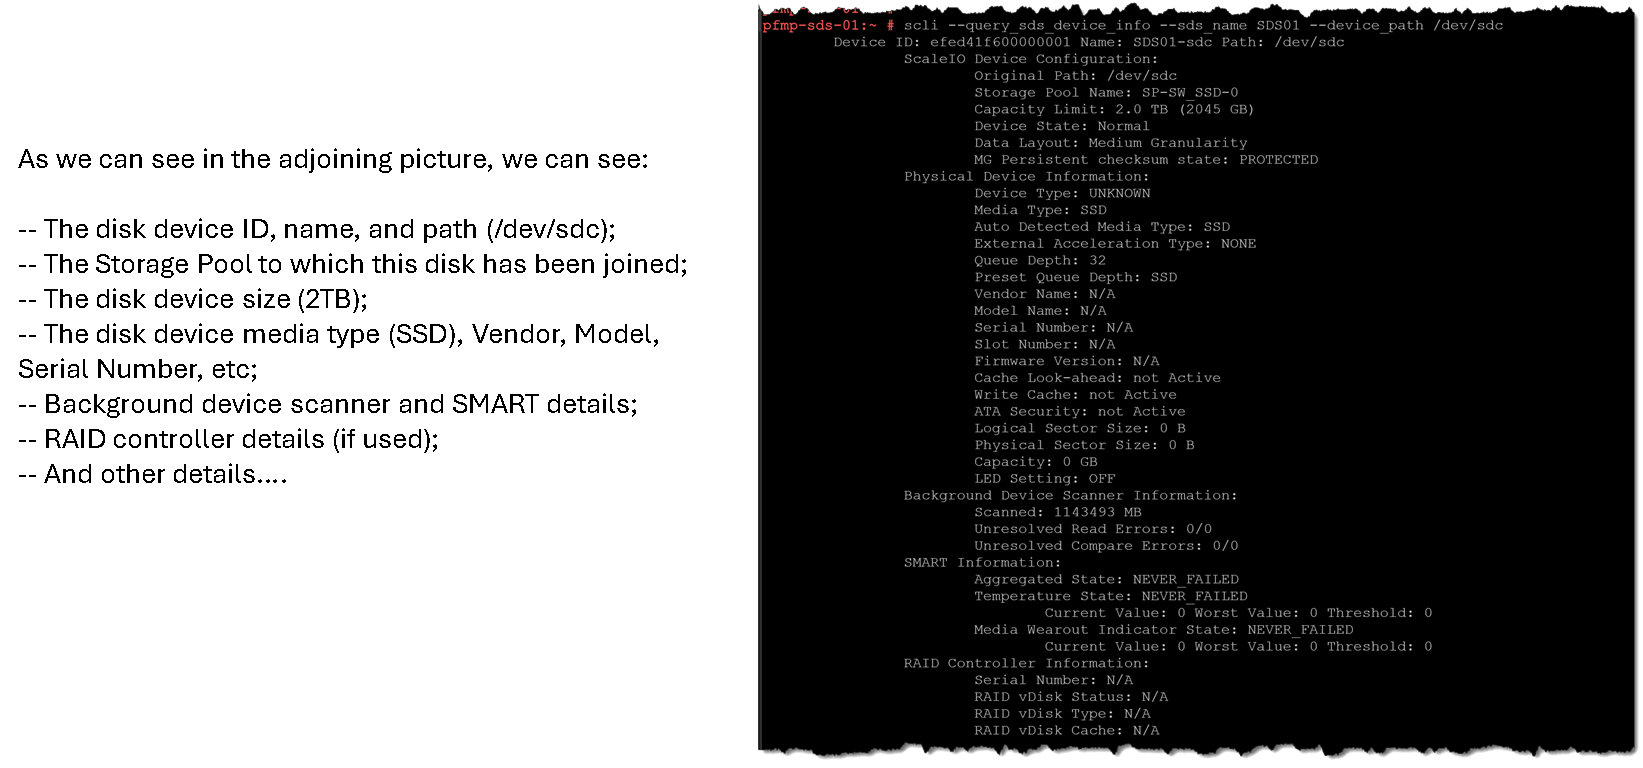
Grabbing All Disk Devices of a Specific SDS
As we know, each SDS node has local disk devices that are used to create a storage pool. If you need to get details of all disk devices of a specific SDS node, you can use the following command line – In this example, the SDS name is “SDS01” (replace it with your SDS name):
scli --query_sds_device_info --sds_name SDS01 --all_devices | grep -i "Device ID:"As shown, this SDS node has four disk devices:

Grabbing All Disk Devices on All SDS
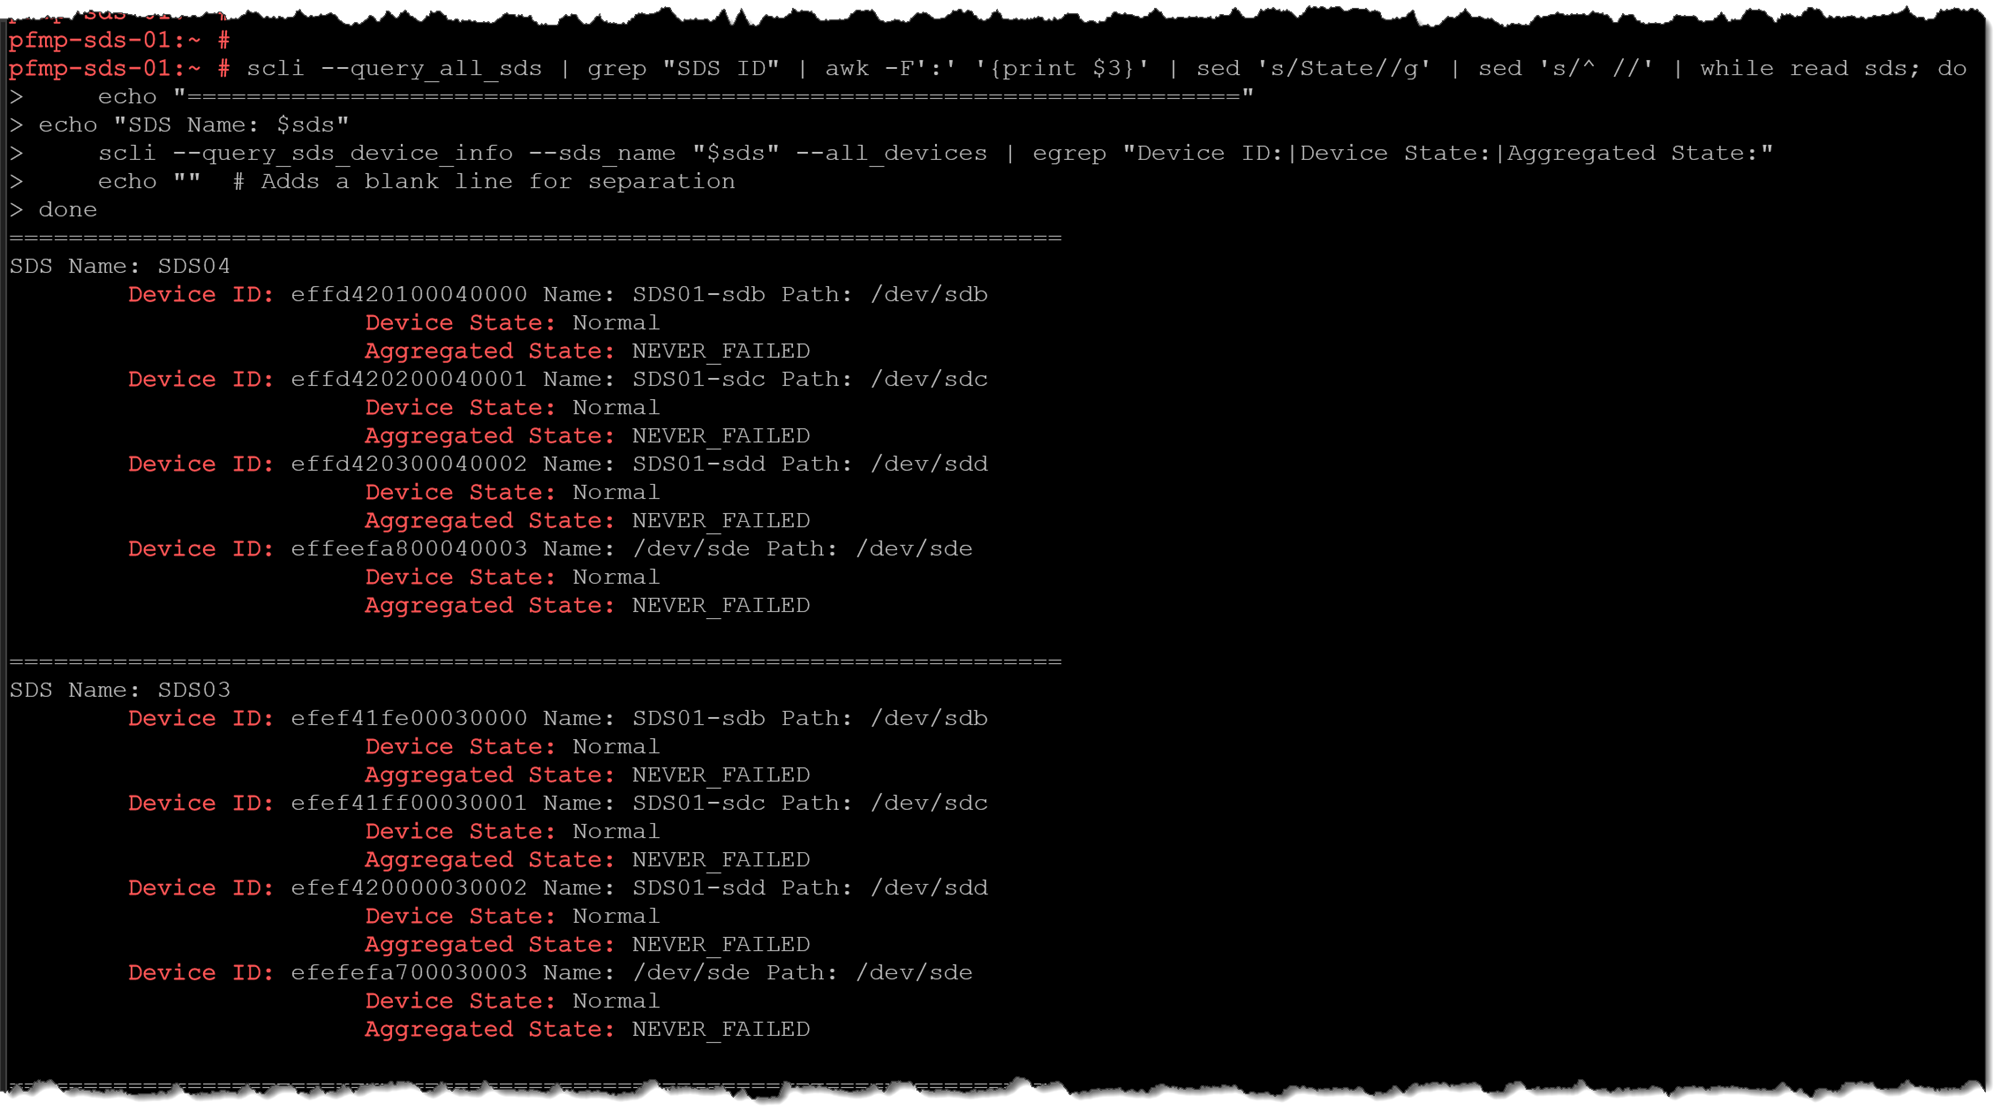
Otherwise, if you need to get all disk devices for all SDS nodes present on the PowerFlex environment, you can use the following command:
scli --query_all_sds | grep "SDS ID" | awk -F':' '{print $3}' | sed 's/State//g' | sed 's/^ //' | while read sds; do
    echo "======================================================================="
	echo "SDS Name: $sds"
    scli --query_sds_device_info --sds_name "$sds" --all_devices | egrep "Device ID:|Device State:|Aggregated State:"
    echo ""  # Adds a blank line for separation
done
This command has an enormous output, so it was cut (we are showing only the first entries).
As shown, for each disk device, we can see its details such as device ID, device name, device path, and the device state – This command can be helpful to perform a disk device health check in a PowerFlex environment, for instance:
Checking SDS Status
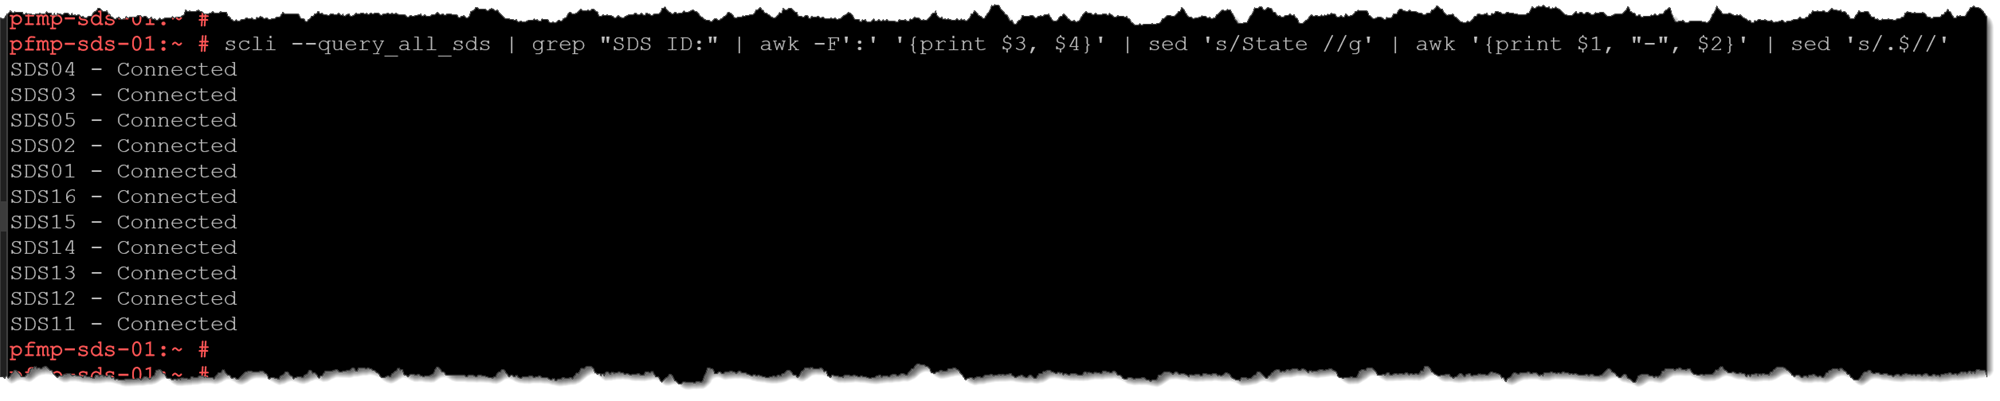
Each SDS node has the “sds” daemon running on it. So, based on it, we can check the SDS connection status if the following command:
scli --query_all_sds | grep "SDS ID:" | awk -F':' '{print $3, $4}' | sed 's/State //g' | awk '{print $1, "-", $2}' | sed 's/.$//'As shown, all SDS nodes are “Connected”:
In case of problems with some SDS nodes (some network issues or something related that cause a network disconnection), we can see a different status than “Connected”. As shown, the SDS node “SDS05” is “Disconnected”:

You can access the SDS as disconnected and perform some troubleshooting (e.g., checking the status of the SDS daemon and network connectivity).
Checking SDS Maintenance Activity
We can use the following command to check if there are any SDS nodes in maintenance mode:
scli --query_all_sds | grep "SDS ID:" | grep "IN_MAINTENANCE" | awk -F' ' '{print $5 " - " $13}'If there is a node in maintenance mode, we will see it in the command output:

Checking SDC and Data-Path Status
In the same way as SDS, each SDC establishes a connection with the MDM cluster. So, we can see their connection status. We can use the following command:
scli --query_all_sdc | grep "SDC ID:" | awk -F" " '{print $5 " - Status: " $9}'In the first output column, we can see the SDC name, followed by its status (Connected or Disconnected):
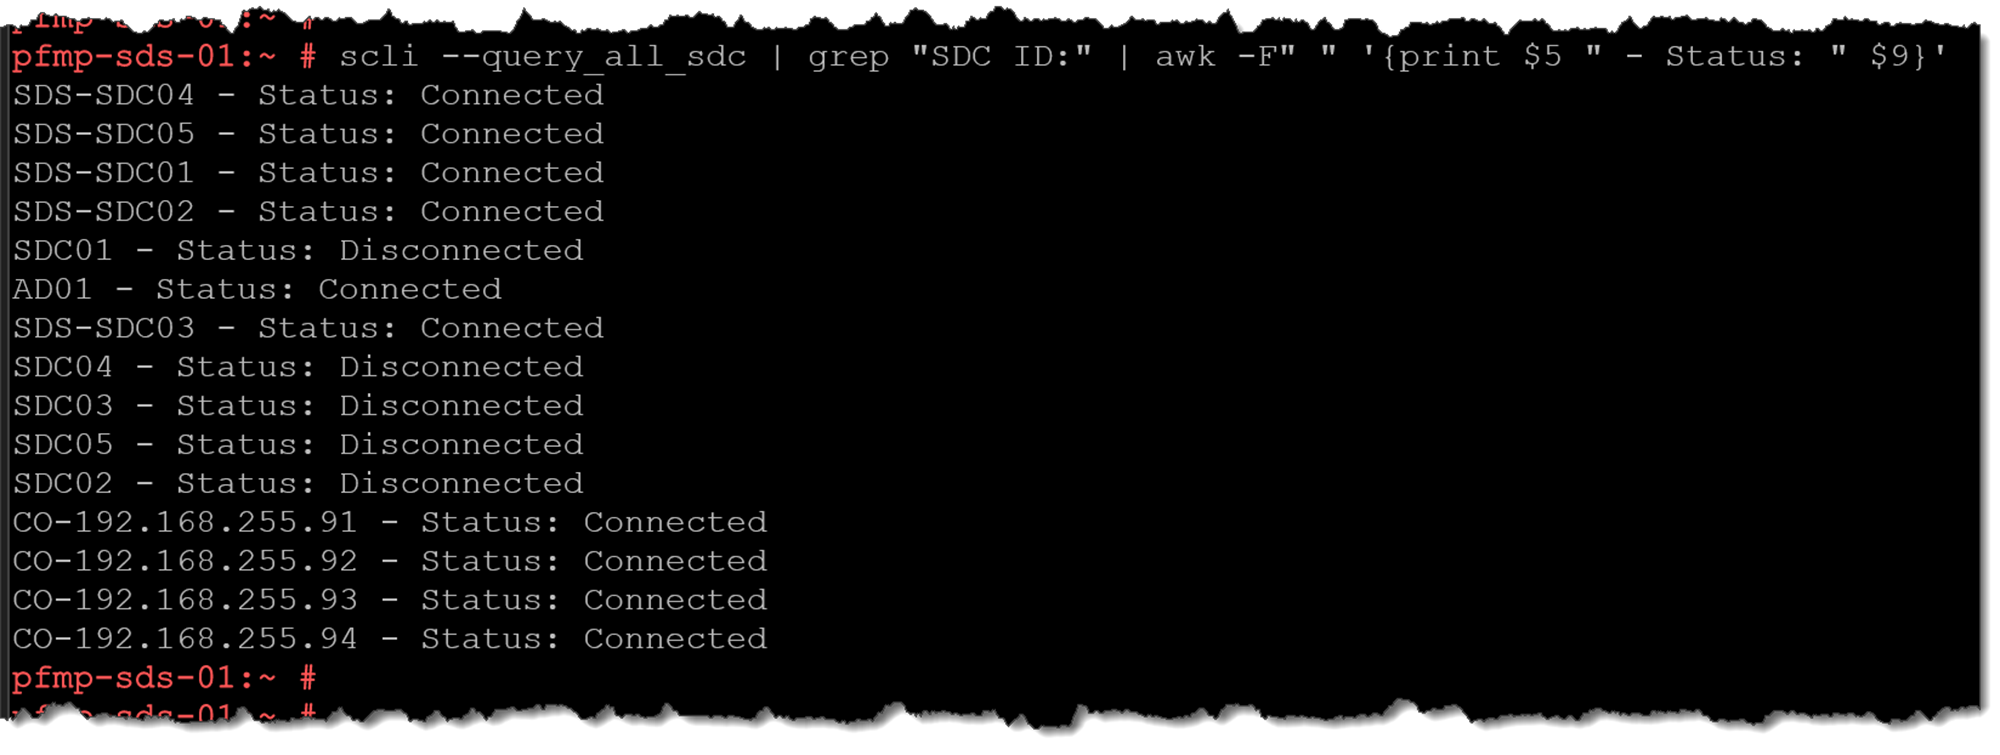
Note: Do not equate State: Connected in an SDC inventory record with proof that every data-plane connection to every SDS is healthy.
Grabbing all PowerFlex Volumes
To grab all volumes in the PowerFlex environment:
scli --query_all_volumes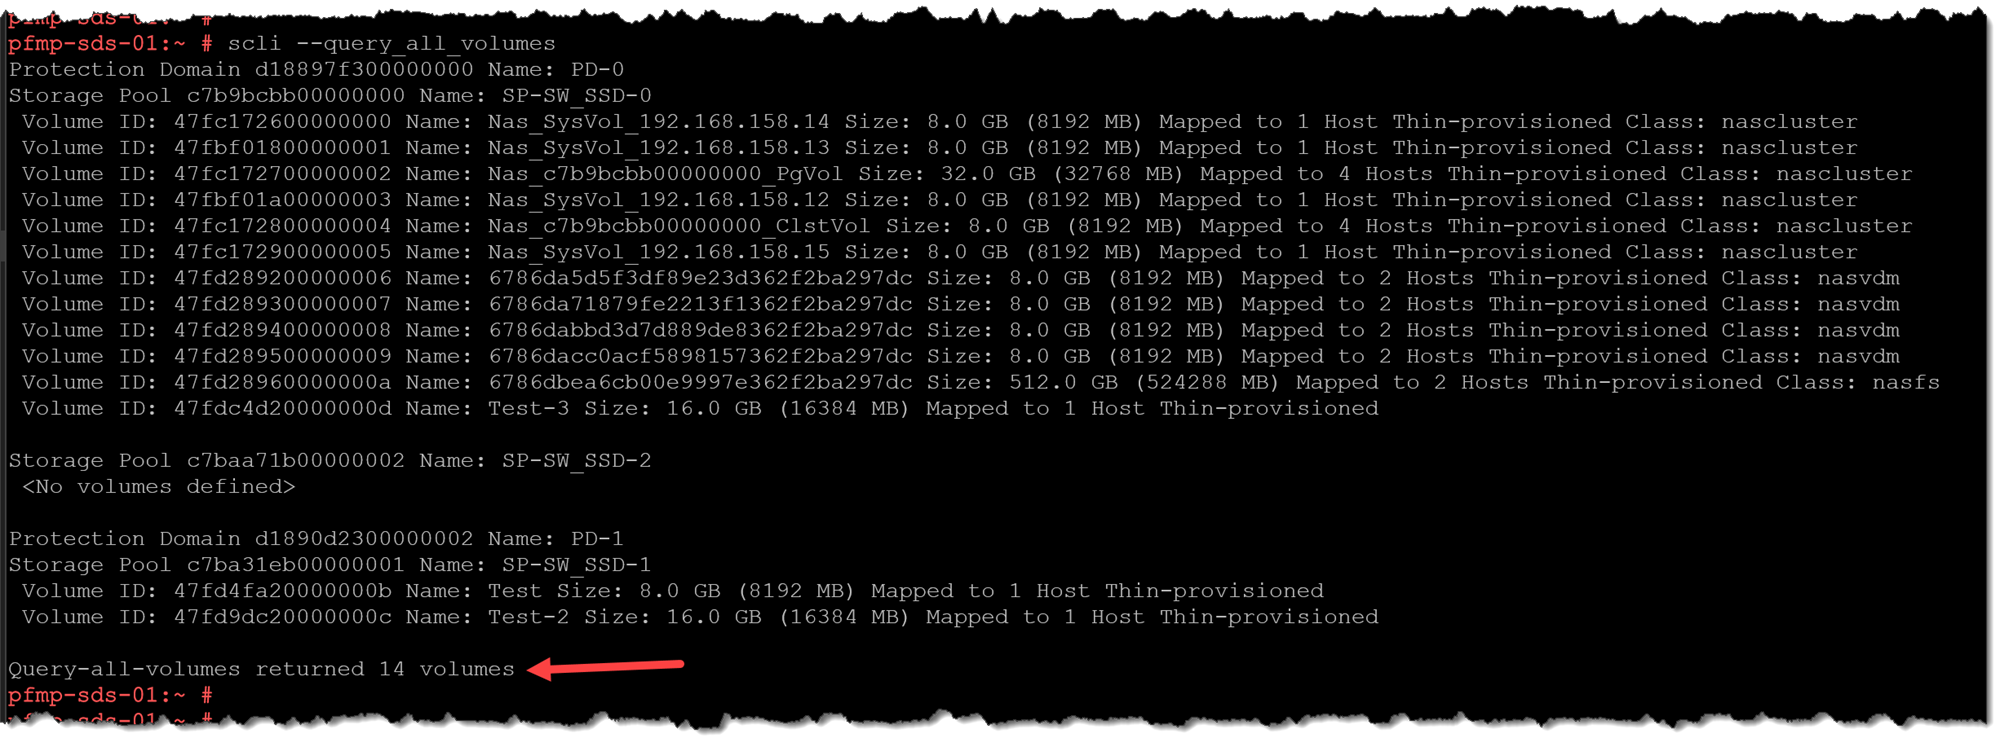
If you want to see the end-to-end workflow for creating and mapping a volume to a Linux SDC, see Adding and Mapping a New Volume to a Linux SDC. Mapping presents the block device to the host; partitioning and formatting it are separate steps.
Querying Volume Creation Time
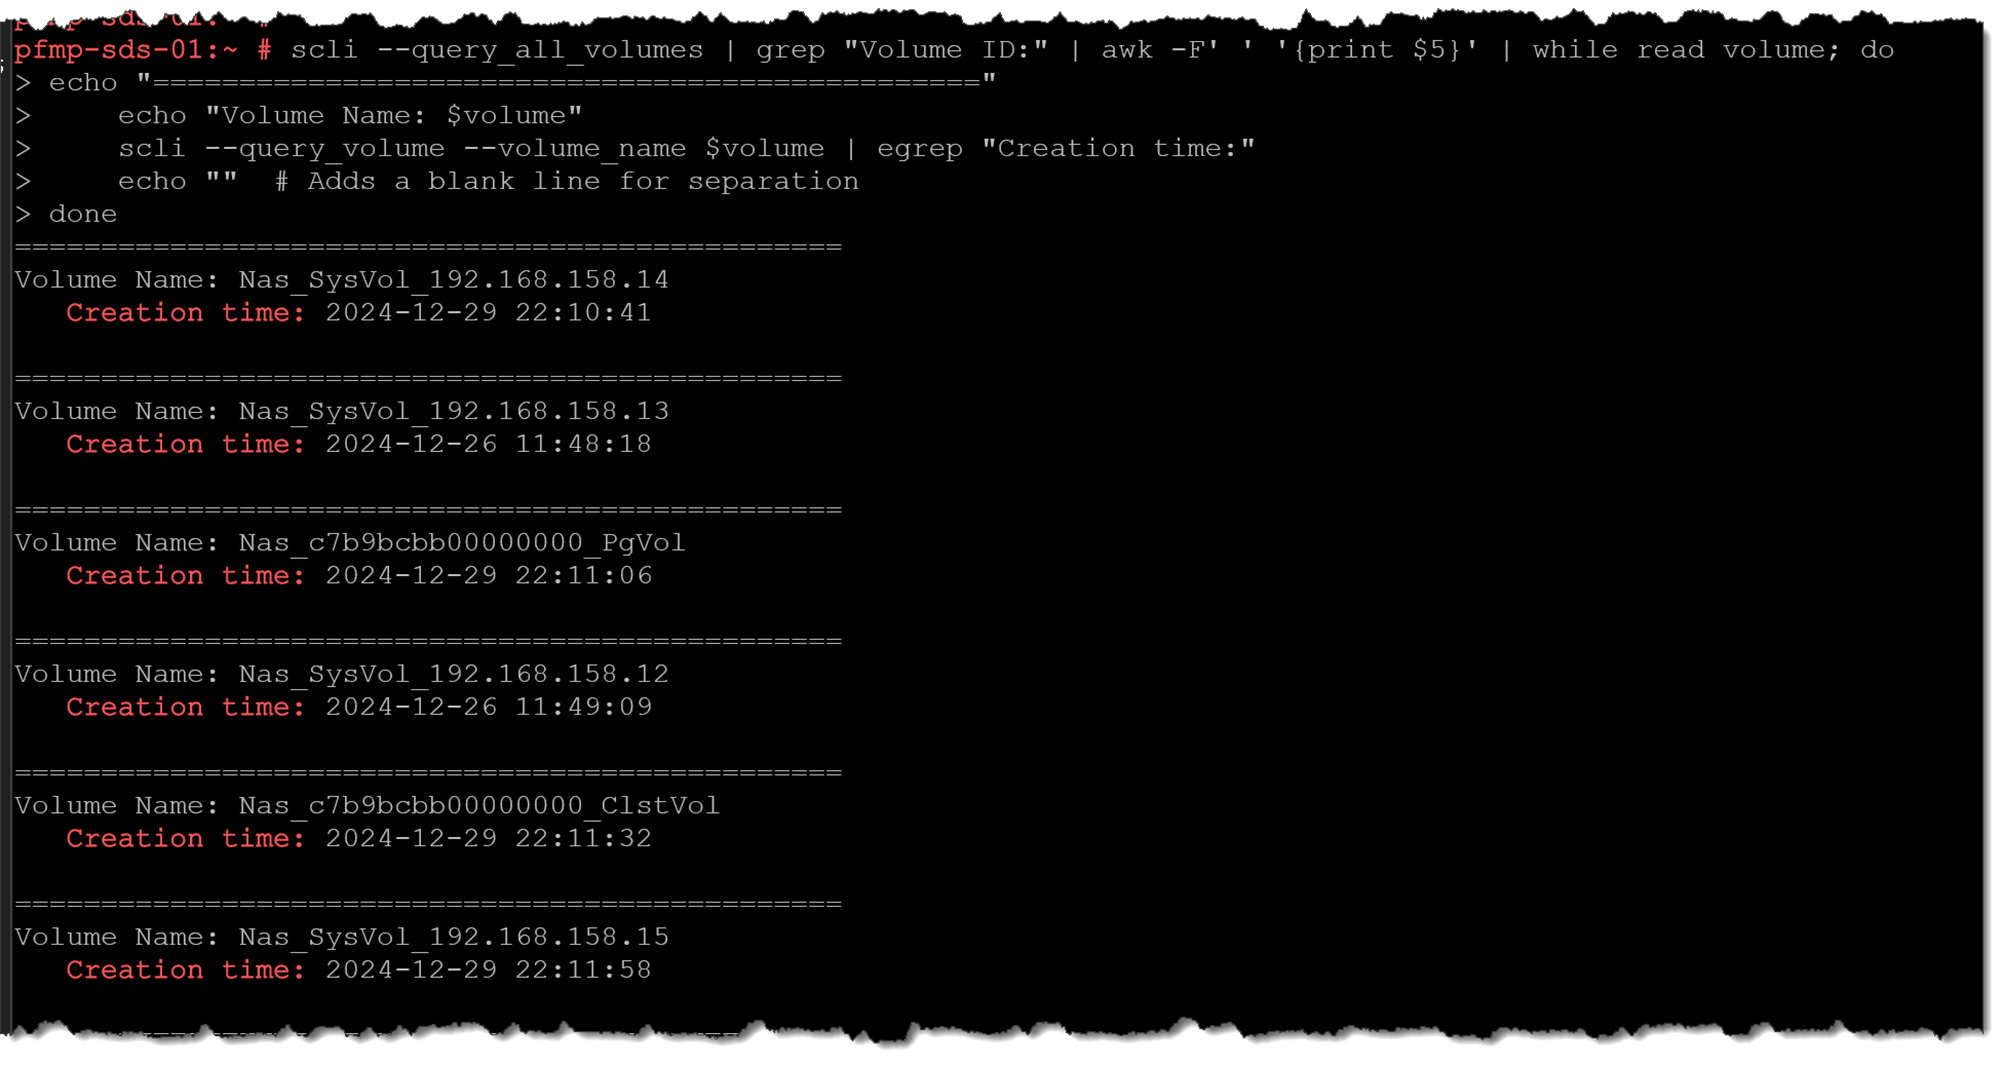
For one known volume, query it by ID and inspect the Creation time field:
scli --query_volume --volume_id <VOLUME_ID>To iterate through the volume IDs reported by query_all_volumes and print the creation time for each, use this Bash/GNU-tools example:
scli --query_all_volumes | grep "Volume ID:" | awk -F' ' '{print $5}' | while read volume; do
	echo "================================================"
    echo "Volume Name: $volume"
    scli --query_volume --volume_name $volume | egrep "Creation time:"
    echo ""  # Adds a blank line for separation
done
Since the output was enormous, it was cut:
Querying Volume IOPS
The following command will get the read-and-write IOPS details for all PowerFlex Volumes:
scli --query_all_volumes | grep "Volume ID:" | awk -F' ' '{print $5}' | while read volume; do
	echo "================================================"
    echo "Volume Name: $volume"
	echo "Timestamp:" `date`
    scli --query_volume --volume_name $volume | egrep "Reads:|Writes:"
    echo ""  # Adds a blank line for separation
done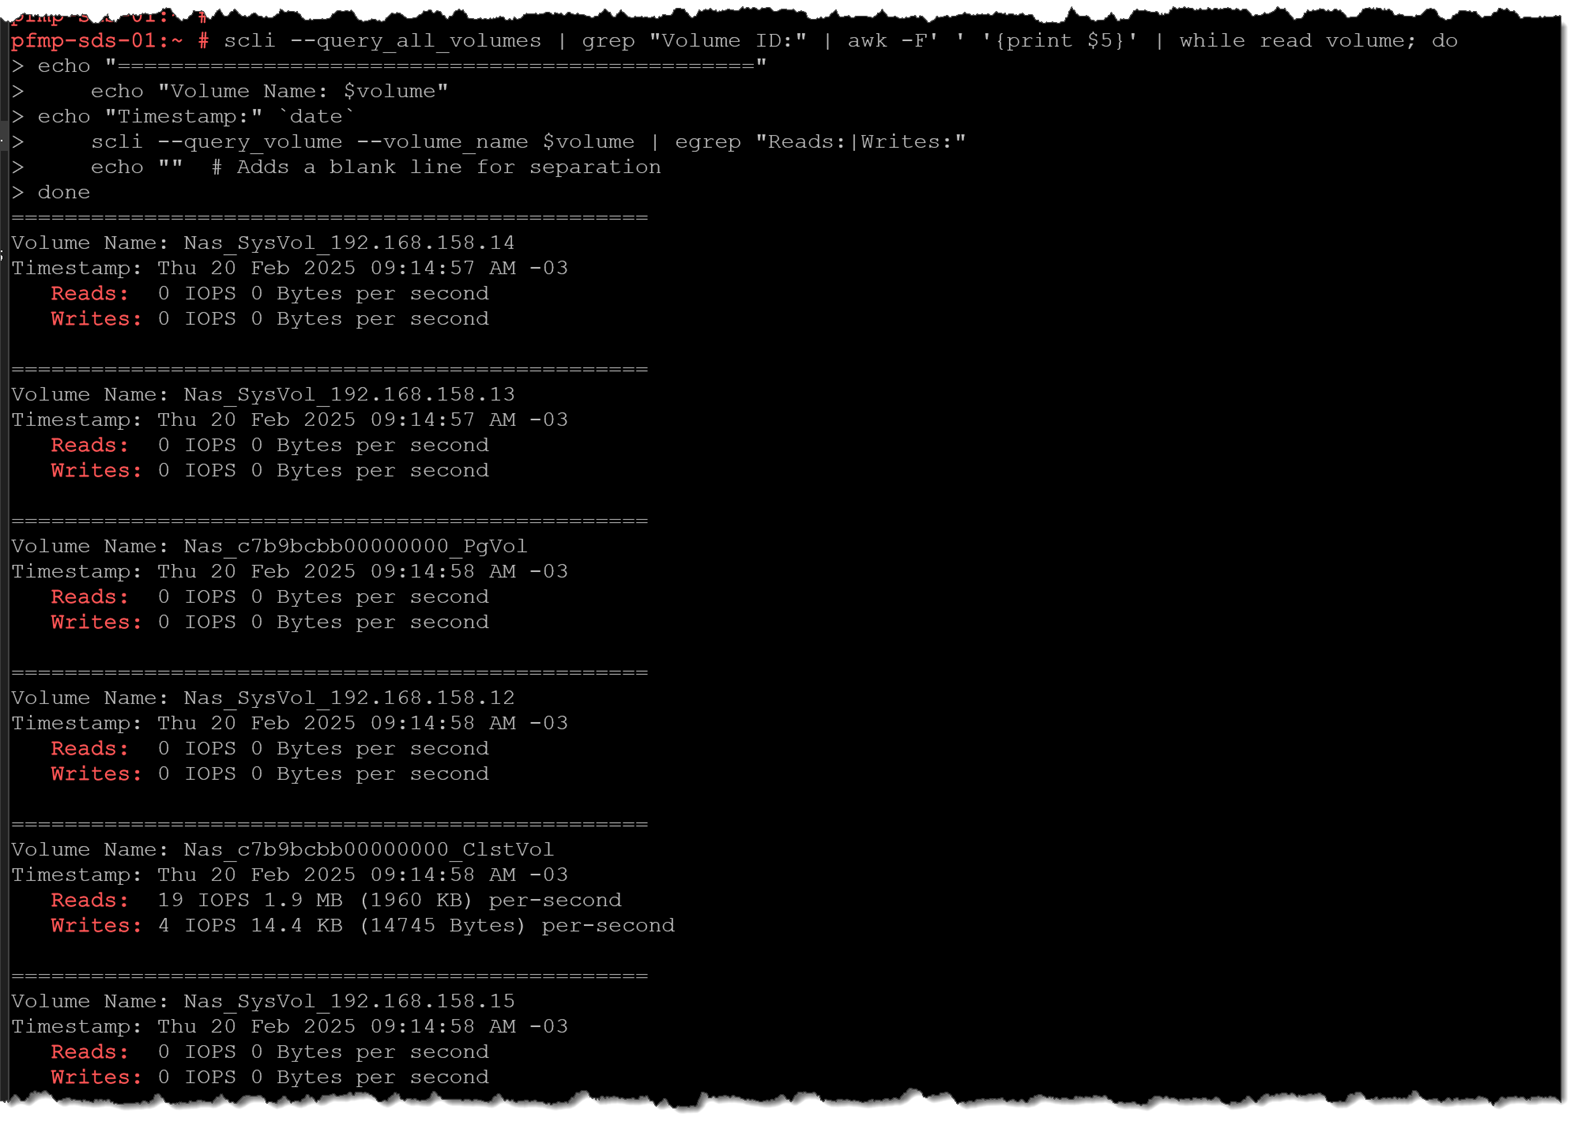
These are point-in-time counters in the query output, not a historical performance graph. To query metrics for each volume-to-SDC mapping, use Dell’s dedicated meters command:
scli --query_volume_sdc_meters --volume_id <VOLUME_ID>With a volume ID and no SDC selector, this command reports metrics for all mappings of that volume, including IOPS, bandwidth, and average latency.
Querying Volume Mappings
After creating a volume, we must map it to an SDC to use it effectively. The following command lists all Volumes and which SDCs are using it:
scli --query_all_volumes | grep "Volume ID:" | awk -F' ' '{print $5}' | while read volume; do
	echo "================================================"
    echo "Volume Name: $volume"
    scli --query_volume --volume_name $volume | egrep "Mapping:|Host ID:"
    echo ""  # Adds a blank line for separation
done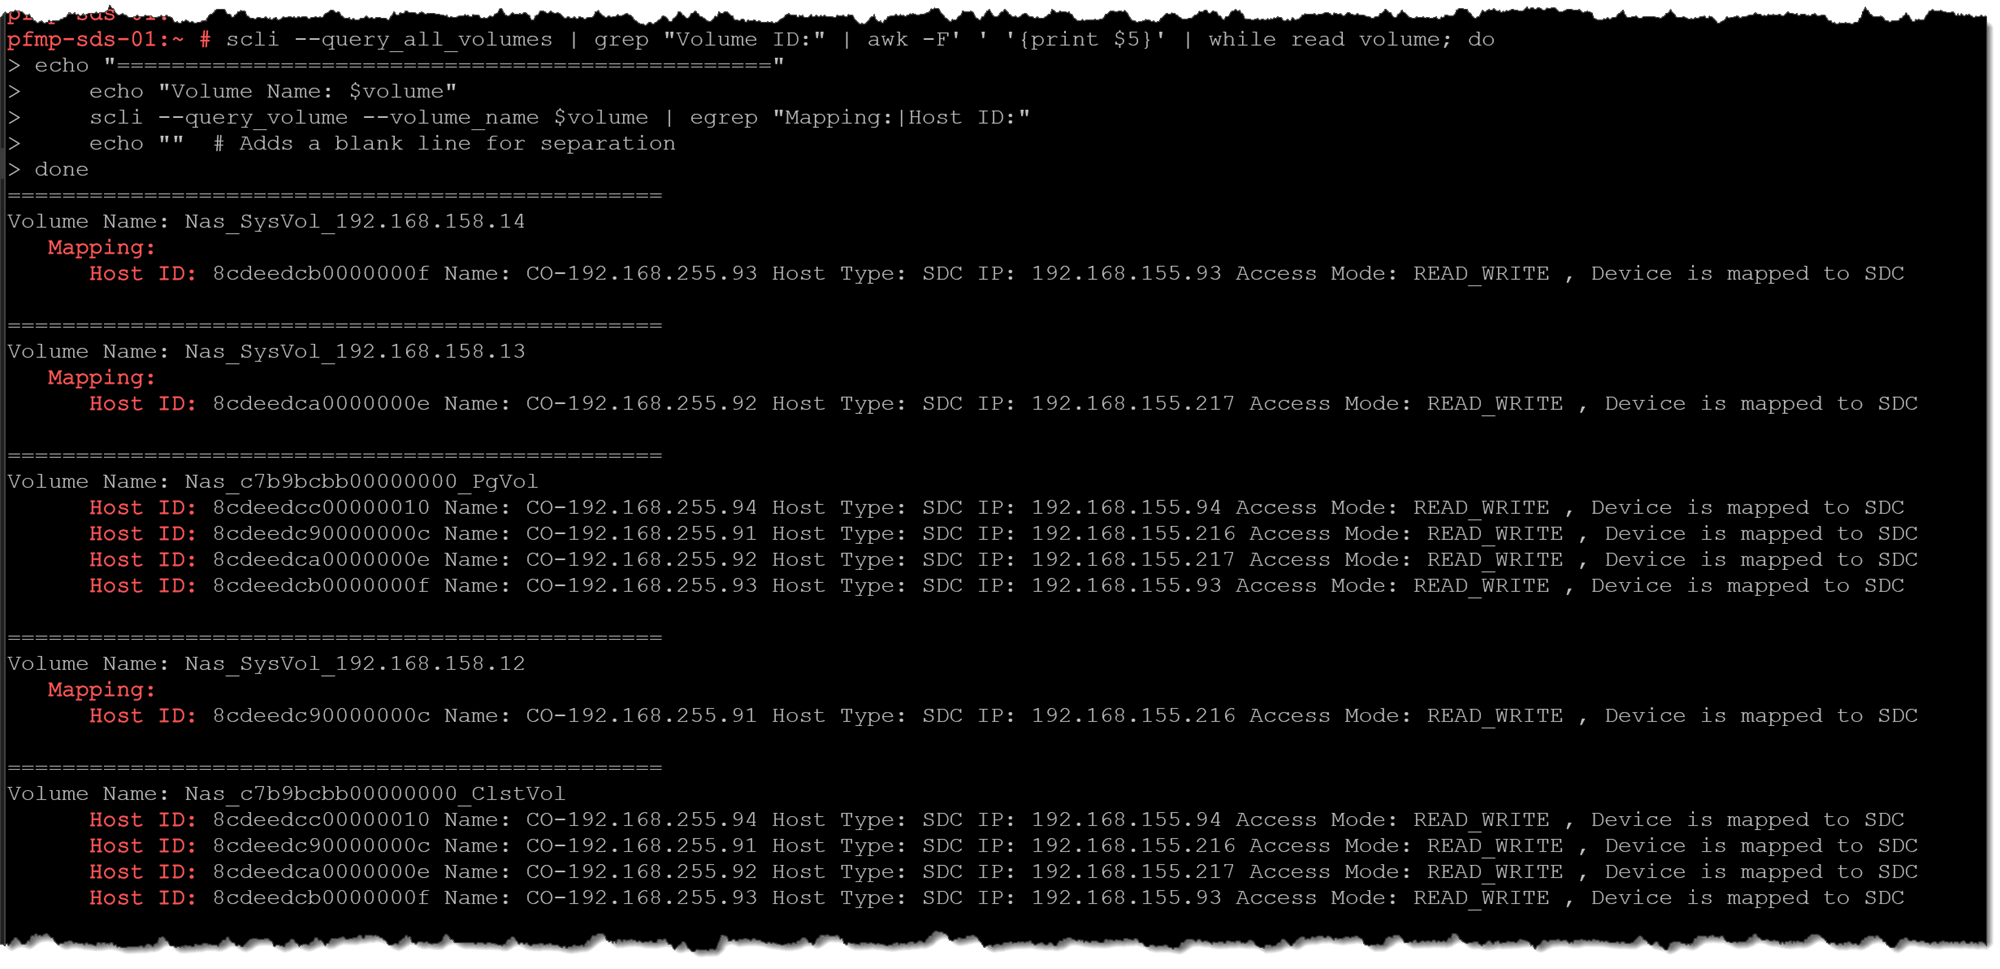
These examples focus on cluster queries and inventory. For SDC-specific tasks, continue with Rename PowerFlex SDCs with SCLI for a Clearer ESXi Inventory or the ESXi SDC installation walkthrough.
Put SCLI Queries to Work Safely
SCLI can quickly show the PowerFlex cluster’s MDM roles, SDS and SDC inventory, device details, volume mappings, and point-in-time counters. Use the native query output when it provides the information you need, and avoid scripts that depend on fixed field positions in human-readable results.
Before running an operational command, confirm the target MDM, resource name or ID, and the effect of the action. The queries in this guide are useful for learning and troubleshooting; validate the installed release’s CLI reference and test any parsing or automation in a lab before using it in production.
External References
- Dell — PowerFlex 4.5.x CLI Reference: Accessing SCLI Explains that SCLI is provided with the MDM component and lists the CLI command names for Linux, VMware, and Citrix Hypervisor.
- Dell — PowerFlex 4.5.x CLI Reference: Login Documents credential-based and P12 certificate login syntax, secure password prompting, and the management certificate trust prerequisite.
- Dell — PowerFlex 4.5.x CLI Reference: Command Format Explains the `–mdm_ip` option, when it can be omitted, and how to target the Primary MDM from a Secondary MDM or a separate CLI host.
- Dell — PowerFlex 4.5.x CLI Reference: Switch MDM Ownership Provides the supported syntax for transferring Primary MDM ownership by the target MDM’s ID, IP address, or name.
- Dell — PowerFlex 4.5.x CLI Reference: Query Cluster Documents the MDM cluster query, cluster modes, state, Primary and Secondary MDMs, virtual IP information, and the optional certificate details.
- Dell — PowerFlex 4.5.x CLI Reference: Query All SDSs Describes how to list SDS nodes and the labels included in the output, such as SDS ID, name, state, IP, port, and version.
- Dell — PowerFlex 4.5.x CLI Reference: Query an SDS Documents the detailed SDS query, including distinct membership, connection, SDS, device, and maintenance-job fields.
- Dell — PowerFlex 4.5.x CLI Reference: Query SDS Device Information Documents queries for one device or all devices in one SDS and shows the device, physical, scanner, SMART, and RAID information returned.
- Dell — PowerFlex 4.5.x CLI Reference: Query All SDCs Documents the SDC inventory query, optional output switches, and fields such as state, GUID, OS type, loaded and installed versions, and read/write counters.
- Dell — PowerFlex 4.5.x CLI Reference: Query All Provides a system-wide summary, including aggregate SDC–SDS connectivity, SDS summary counts, maintenance activity, capacity, and Storage Pool information.
- Dell — PowerFlex 4.5.x CLI Reference: Query a Protection Domain Documents how to retrieve aggregated information about a Protection Domain by its name or ID.
- Dell — PowerFlex 4.5.x CLI Reference: Query a Storage Pool Documents how to query a Storage Pool by Protection Domain and pool name, or directly by Storage Pool ID.
- Dell — PowerFlex 4.5.x CLI Reference: Query SDC-to-SDS Disconnections Documents a separate query for disconnections between SDCs and SDSs, distinct from the SDC inventory state.
- Dell — PowerFlex 4.5.x CLI Reference: Query All Volumes Documents how to list volumes and filter results by Protection Domain, Storage Pool, or snapshot consistency group.
- Dell — PowerFlex 4.5.x CLI Reference: Query a Volume Shows the volume ID/name selectors and output fields for creation time, read/write counters, and mappings.
- Dell — PowerFlex 4.5.x CLI Reference: Query Volume SDC Meters Provides per-mapping read/write IOPS, bandwidth, and latency counters for a selected volume, SDC, or volume-to-SDC mapping.
