

Lustre filesystem commands can seem intimidating when an administrator first starts managing an HPC cluster. A single filesystem may involve metadata servers, object storage servers, multiple targets, specialized networking, and hundreds of clients accessing data at the same time.
Fortunately, daily Lustre administration does not always require advanced knowledge of its internal architecture. A relatively small set of commands can reveal whether the filesystem is mounted, how much storage remains, where files are located, and which components may be experiencing problems.
This practical guide covers the basic Lustre filesystem commands administrators can use for routine checks and first-level troubleshooting. The examples assume that the Lustre client utilities are installed and that the filesystem is mounted at /lustre, for example.
First and Foremost: What Is Lustre and Why Is It Used in HPC?
Lustre is an open-source parallel filesystem designed for environments that need to store and process large volumes of data across many servers and compute nodes. It provides a shared filesystem namespace while distributing storage responsibilities among several specialized components.
In a basic Lustre architecture, Metadata Servers (MDS) manage filenames, directories, permissions, and file layouts through Metadata Targets (MDT). Object Storage Servers (OSS) provide access to Object Storage Targets (OST), where the actual file data is stored, while Lustre clients communicate with these services through LNet (network used by Lustre).
If you want a deeper explanation of how the Lustre components, file layouts, FIDs, and read/write paths work together, see “Getting Started with Lustre File System“.
This architecture is widely used in HPC clusters because many compute processes can read and write data in parallel. Understanding the roles of the MDTs, OSTs, servers, clients, and LNet also helps administrators determine whether a problem is related to metadata, storage capacity, file placement, network connectivity, or the client itself.
Confirm That the Lustre Filesystem Is Mounted
Before investigating targets, striping, or network connectivity, confirm that the client has mounted the filesystem:
mount -t lustre
A cleaner alternative is:
findmnt -t lustre
findmnt displays the mount point, source, filesystem type, and mount options. The source normally includes one or more Management Server NIDs followed by the Lustre filesystem name.
You can also check whether a persistent mount is configured locally:
grep -i lustre /etc/fstab
This is common in smaller environments where Lustre filesystems are mounted directly during system startup. In larger HPC clusters, however, mounts may be managed through autofs, centralized LDAP or SSSD maps, configuration-management systems, or native systemd automount units.
Check whether autofs is active:
systemctl status autofsInspect the autofs master map:
grep -vE '^[[:space:]]*(#|$)' /etc/auto.masterSome systems also load additional maps from:
ls -l /etc/auto.master.d/Search the local automount configuration for Lustre entries:
grep -Rni lustre /etc/auto.master /etc/auto.master.d /etc/auto.* 2>/dev/nullIf systemd automount units are used instead, list them with:
systemctl list-units --type=automountIn this example, the Lustre filesystem is managed through a systemd mount unit named lustre.mount:
systemctl list-units --type=mount | grep -i lustre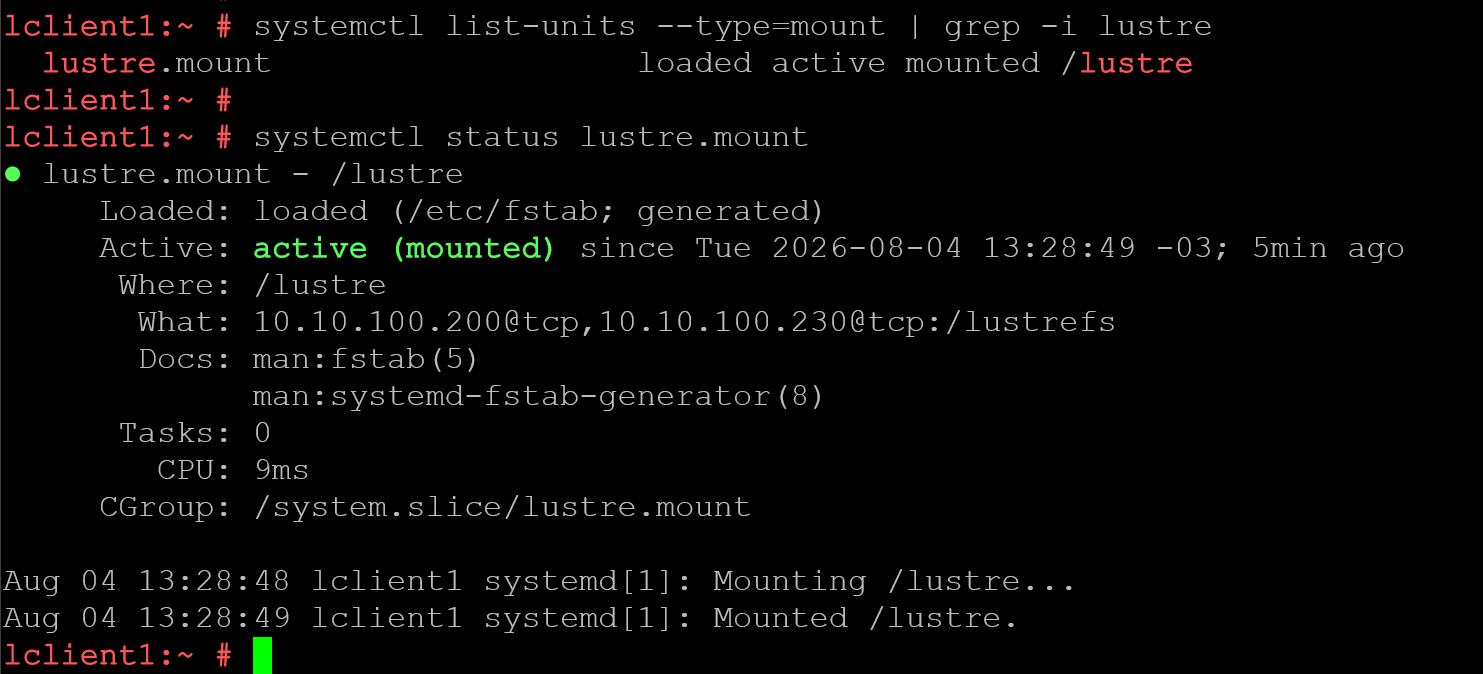
Keep in mind that centralized autofs maps may come from LDAP, NIS, or SSSD and therefore may not appear in a local auto.* file. Use the following command to see the maps currently recognized by autofs:
automount -mThese checks help determine whether the missing mount is caused by an invalid Lustre configuration, an automount map problem, or an automounter service that is not running.
If the mount is missing, inspect recent kernel messages:
dmesg -T | tail -100On systems using systemd:
journalctl -k --since "30 minutes ago" | grep -i lustre
These checks help distinguish a filesystem problem from a simple client mount failure.
Check Storage and Metadata Capacity with lfs df
The regular Linux df command shows the total capacity of a mounted filesystem, but it does not provide the complete Lustre target view.
Use the following command instead:
lfs df -h /lustre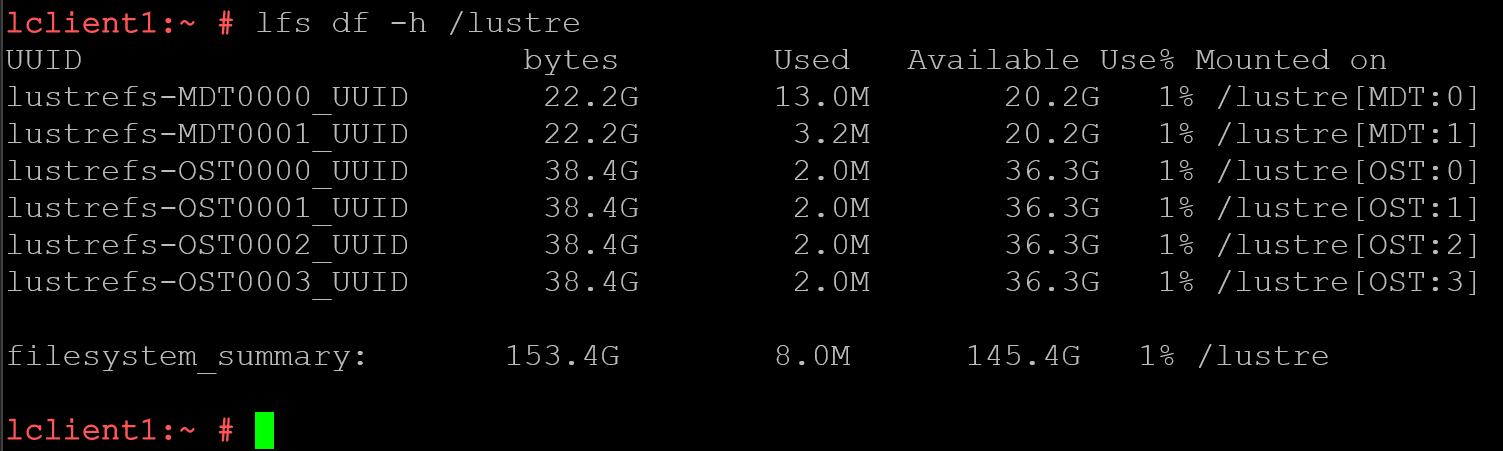
The output usually includes:
- Metadata Targets, identified as MDTs;
- Object Storage Targets, identified as OSTs;
- Total, used, and available capacity;
- Utilization percentage for each target.
Look for OSTs that are significantly fuller than the others. A Lustre filesystem may have plenty of total free space while one OST is almost full. Files striped across that specific target can still receive No space left on device errors.
Check inode and metadata usage separately:
lfs df -ih /lustre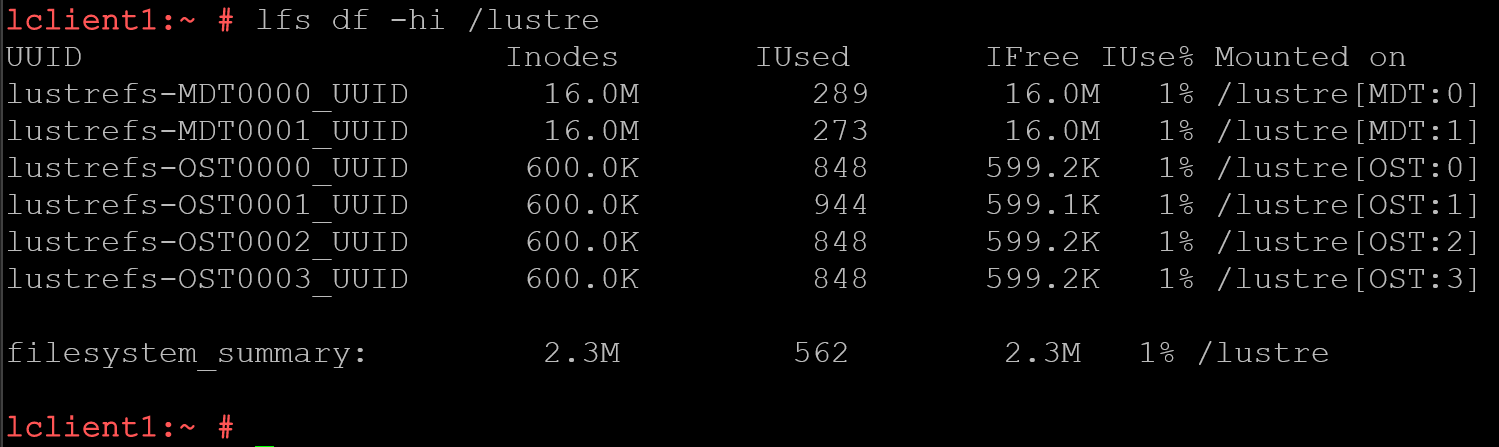
This check is particularly important in environments that create millions of small files. The OSTs may still have terabytes available while metadata resources or inodes are approaching their limits.
For a quick filtered view of OST utilization:
lfs df -h /lustre | grep OST
Important: Do not rely only on the summary line. Individual target utilization usually provides more useful troubleshooting information.
Discover the Filesystem Name
Several Lustre commands require the filesystem name. Retrieve it from the mounted path instead of guessing:
lfs getname /lustre
The result may include the filesystem name and an instance identifier.
You can also display Lustre mount points known to the client:
lctl list_param 'llite.*'Note: This is helpful only when the same node mounts multiple Lustre filesystems. Matching the mount point to the correct llite instance prevents you from inspecting parameters from the wrong filesystem.
Understand File Placement with lfs getstripe
Lustre stores the actual file data on one or more OSTs, while file metadata and layout information are managed through the MDTs:
lfs getstripe /lustre/file.dat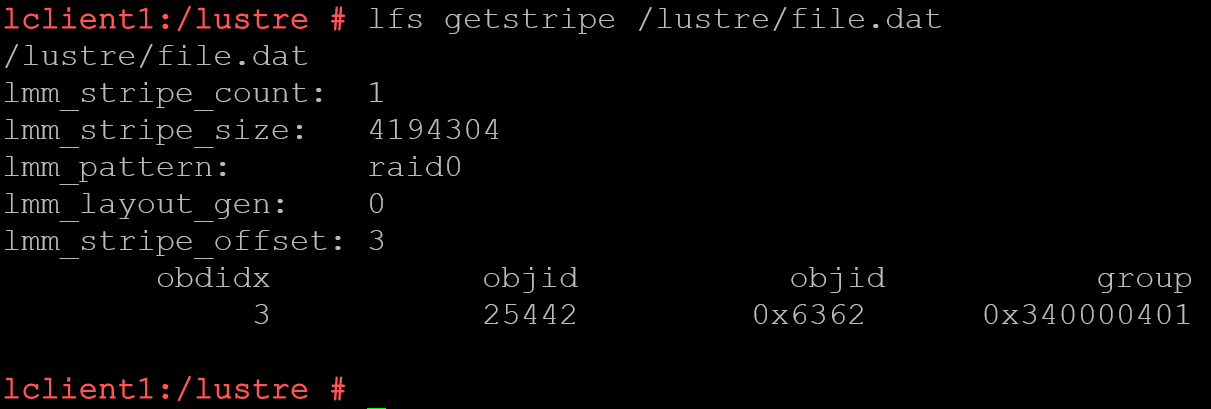
The output may contain:
- Stripe count;
- Stripe size;
- Starting OST;
- OST indexes;
- Object identifiers;
- Layout information.
For basic troubleshooting, focus on the stripe count and the OST indexes holding the file.
Display only the stripe count:
lfs getstripe -c /lustre/file.dat
Display the stripe size:
lfs getstripe -S /lustre/file.dat
Display the starting OST index:
lfs getstripe -i /lustre/file.dat
Directories can define default layouts for newly created files. Inspect a directory with:
lfs getstripe -d /lustre/projectSuppose users report that large files are writing slowly and every file is placed on only one OST. The parent directory may have a stripe count of one configured as its default.
Checking the directory layout can reveal that configuration without requiring advanced performance tools.
Create a Simple Test Layout with lfs setstripe
The lfs setstripe command controls how new files are distributed across OSTs.
Create a test directory:
mkdir /lustre/stripe-testSet a four-OST (-c 4) layout with a 1 MiB stripe size:
lfs setstripe -c 4 -S 1M /lustre/stripe-testVerify the directory default:
lfs getstripe -d /lustre/stripe-test
Create a small test file using dd:
dd if=/dev/zero \
   of=/lustre/stripe-test/testfile \
   bs=1M count=128 status=progress
Inspect its final layout:
lfs getstripe /lustre/stripe-test/testfile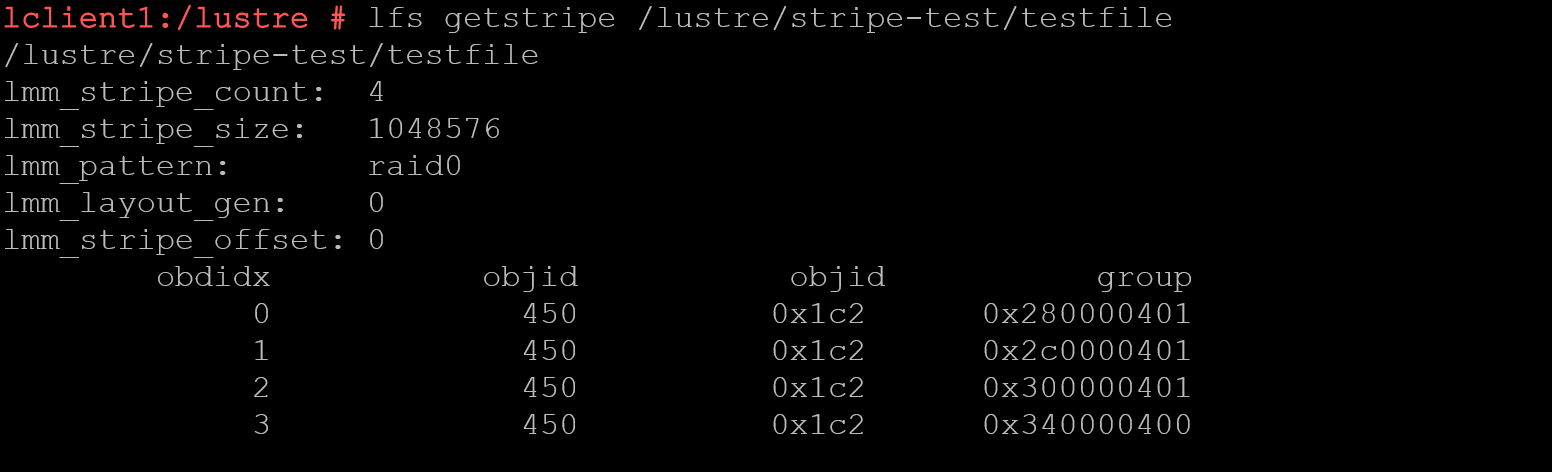
So, as we can see, a directory layout normally applies to files created after the layout is configured. It does not automatically redistribute existing files.
Caution: Do not increase stripe counts across production directories without understanding the workload. More stripes are not automatically better. Small files generally do not benefit from being spread across many OSTs, and unnecessary striping can create additional overhead.
For a beginning administrator, lfs setstripe is most useful for controlled testing and for understanding existing project policies.
List Available OSTs
To display the OSTs visible through a mounted Lustre filesystem, run:
lfs osts /lustre
This provides a quick inventory of Object Storage Targets (OSTs). In the example above, our Lustre filesystem uses four OSTs.
Compare the result with your site documentation or a known healthy client. If an expected OST is missing, inspect:
lctl dl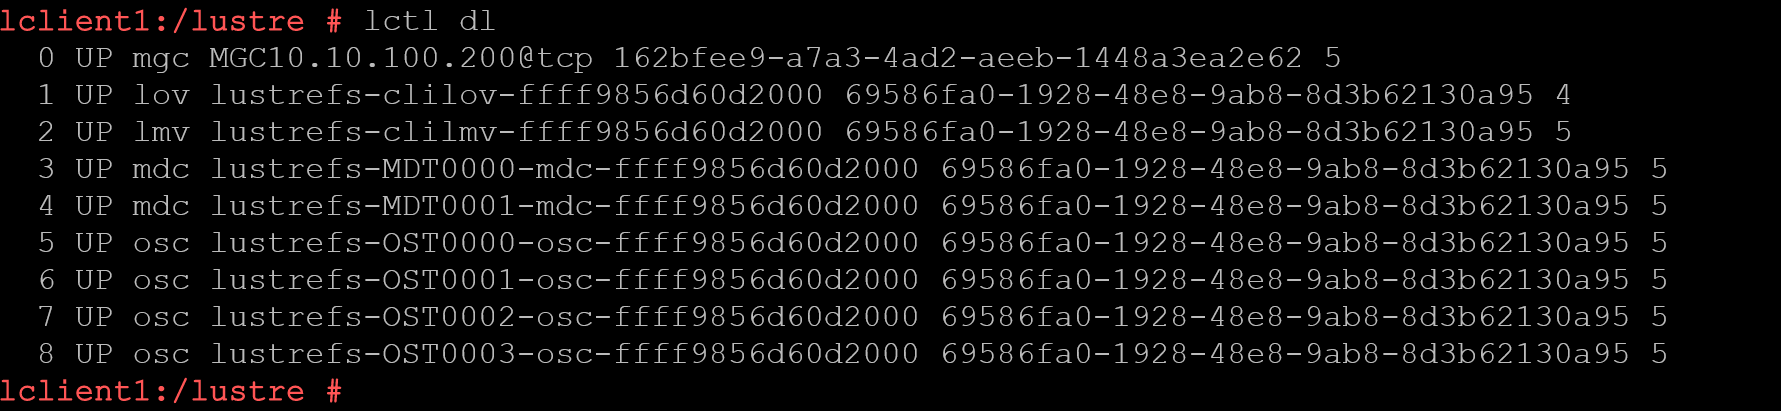
Also review the kernel log for messages involving the missing target – Suppose the missing OST is OST0007, the command would be:
journalctl -k | grep -i OST0007Again, replace OST0007 with the target name reported in your environment.
Note: A target missing from one client may indicate a local connection problem. The same target missing across many clients is more likely to indicate a server, network, or recovery issue.
Inspect OST Pools
Some Lustre environments organize OSTs into pools. Pools may represent different storage hardware, performance levels, projects, or operational policies.
List the pools associated with a filesystem:
lfs pool_list filesystem_nameList the OSTs belonging to one pool:
lfs pool_list filesystem_name.pool_nameCheck whether a directory uses a pool:
lfs getstripe -d -p /lustre/projectA project directory associated with a small or nearly full pool may experience file creation failures even when the entire filesystem has plenty of free space.
Pools are therefore worth checking when one directory behaves differently from other locations on the same Lustre mount.
Find Files Located on a Specific OST
When an OST is almost full or reporting errors, use lfs find to identify files associated with it:
lfs find /lustre --ost 3
The number represents the OST index.
To locate only large files on that target, we can use the following command (In this case, for instance, we’re searching for files higher than 10GB):
lfs find /lustre --ost 3 --size +10GYou can also search a more specific project directory:
lfs find /lustre/projects/weather-model --ost 3Caution: Avoid immediately scanning the entire filesystem root. Large namespace searches can generate considerable metadata activity.
Begin with the most likely user, project, or application directory. Perform broader searches during a maintenance window or after coordinating with the storage team.
This command is useful for investigation, but moving data away from an OST should follow the procedures and policies defined for the cluster.
Inspect Local Lustre Devices with lctl dl
The lctl command provides access to Lustre configuration and runtime information.
A useful, read-only starting point is:
lctl dl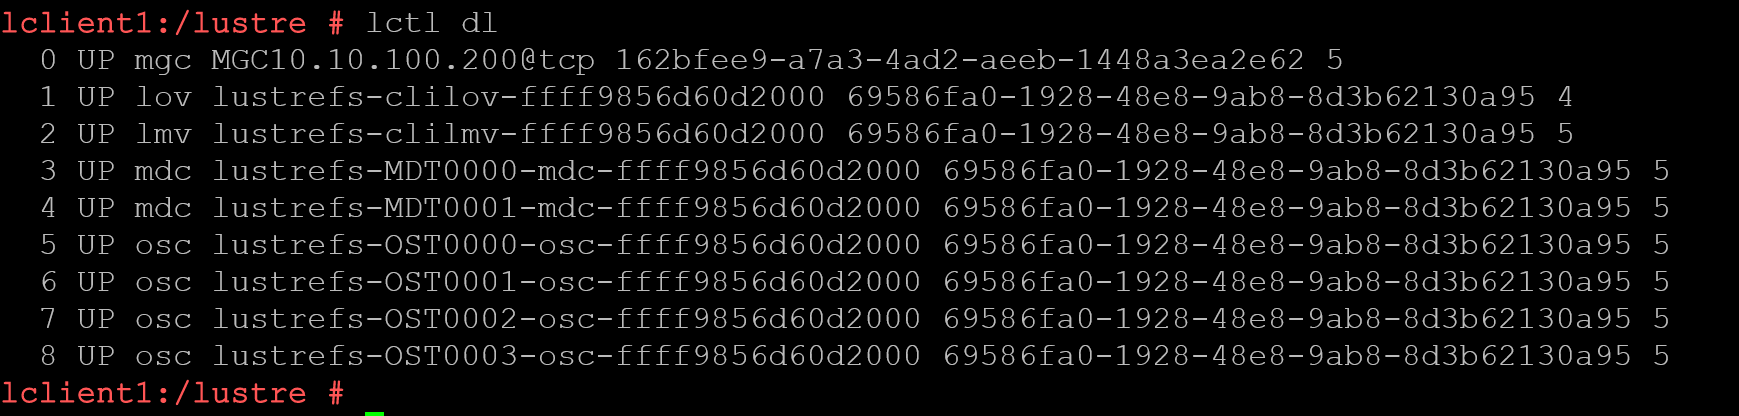
On a client, the output can include:
- Metadata clients;
- Object storage clients;
- Logical Lustre devices;
- Filesystem instances;
- Device states.
Healthy connected devices commonly appear in an UP state.
Look for devices that are inactive, disconnected, or unexpectedly missing. If users report input/output errors and one object storage client is not healthy, the corresponding OST becomes an obvious investigation target.
Run the same command on another compute node:
ssh lclient2 lctl dl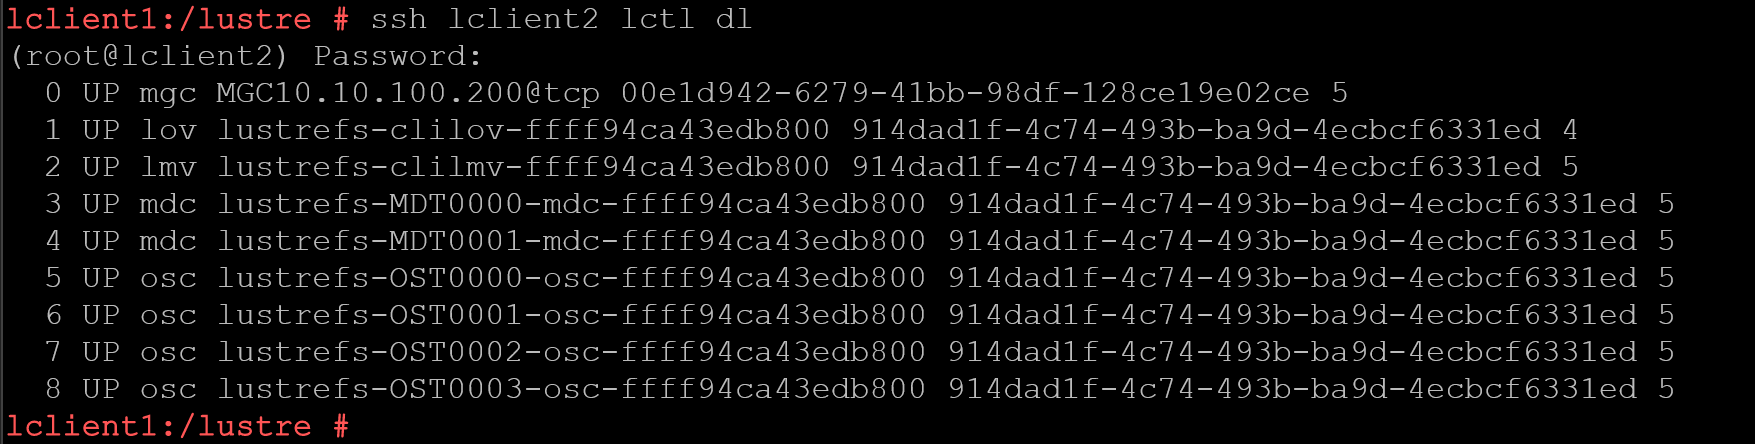
If only one node shows a problem, restart or remount decisions can focus on that client. If several nodes show the same device state, avoid treating it as an isolated client problem.
Read Runtime Information with lctl get_param
Lustre exposes many runtime values through parameters. The standard command for reading them is:
lctl get_param <parameter>Because parameter names vary according to filesystem and target names, discover them first:
lctl list_param -R '*' | lessSearch for a specific subject, for example, “health”, “import”, or “connect”:
lctl list_param | grep -E 'health|import|connect'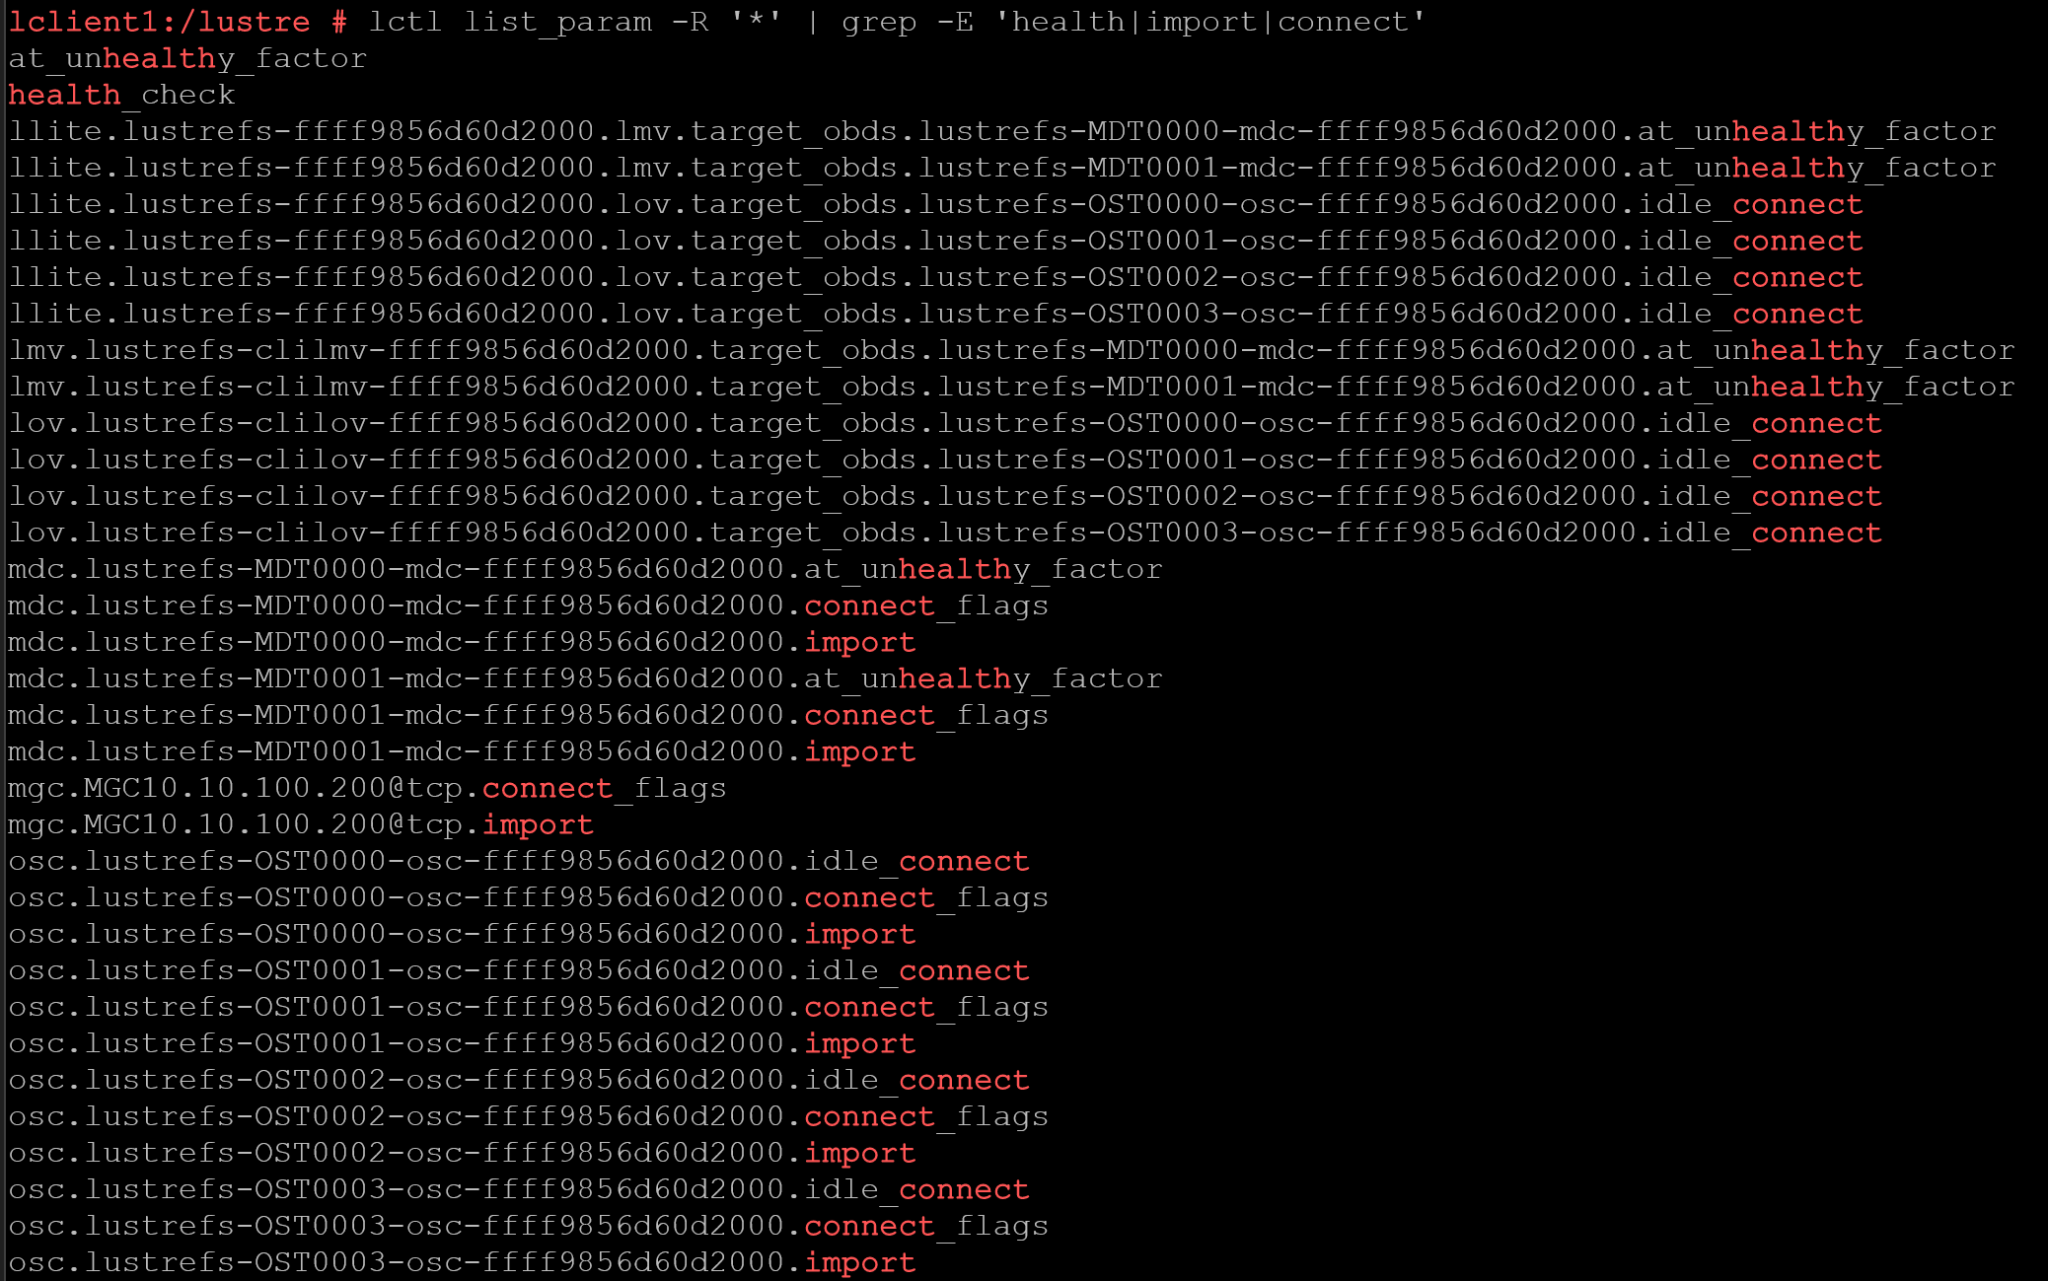
Retrieve a parameter with:
lctl get_param parameter.pathChange the “parameter.path” to the desired parameter. For example:
lctl get_param osc.lustrefs-OST0002-osc-ffff9856d60d2000.connect_flags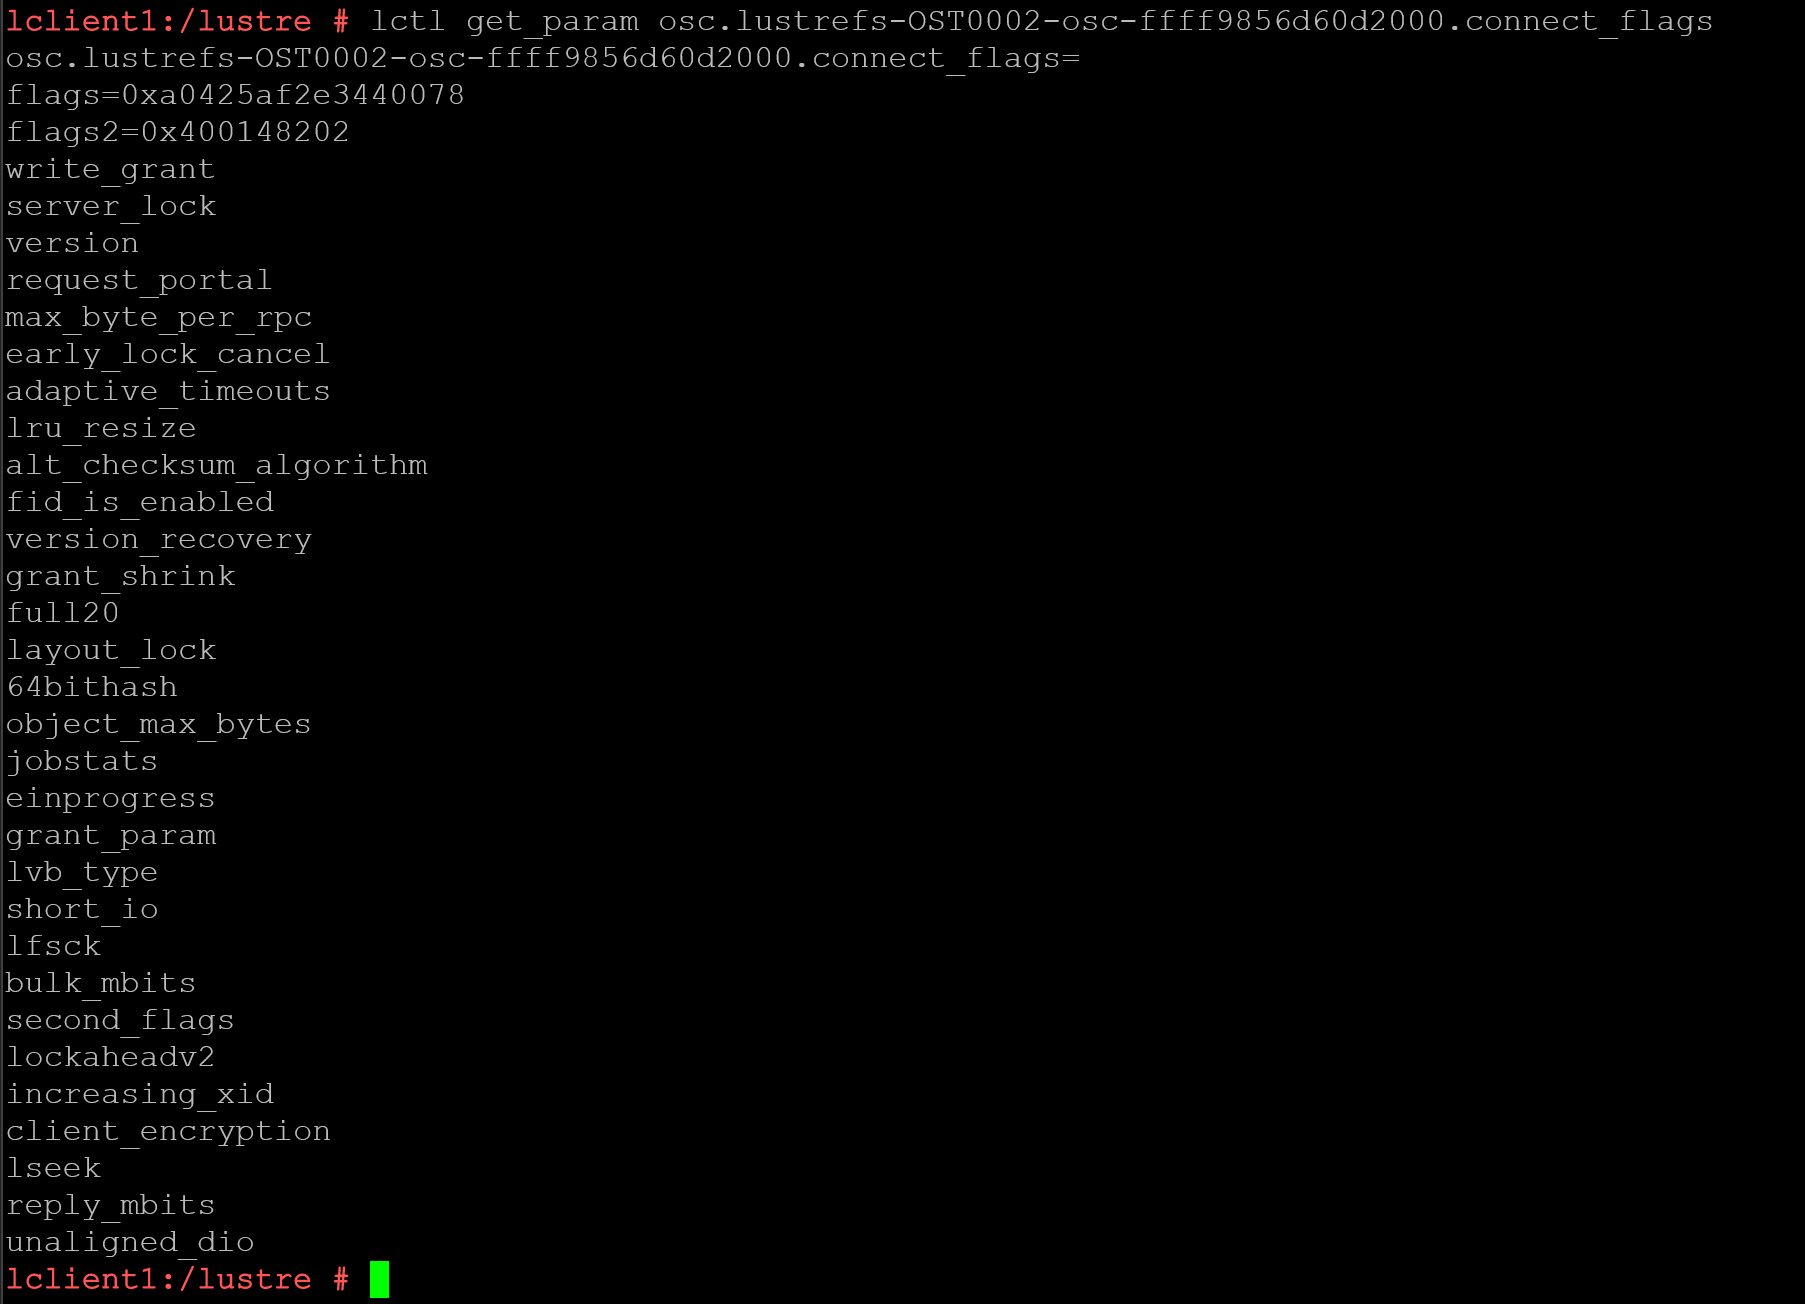
On Lustre servers, a useful basic check is:
lctl get_param health_check
On clients, inspect available OSC and MDC import parameters:
lctl list_param 'osc.*.import'
lctl list_param 'mdc.*.import'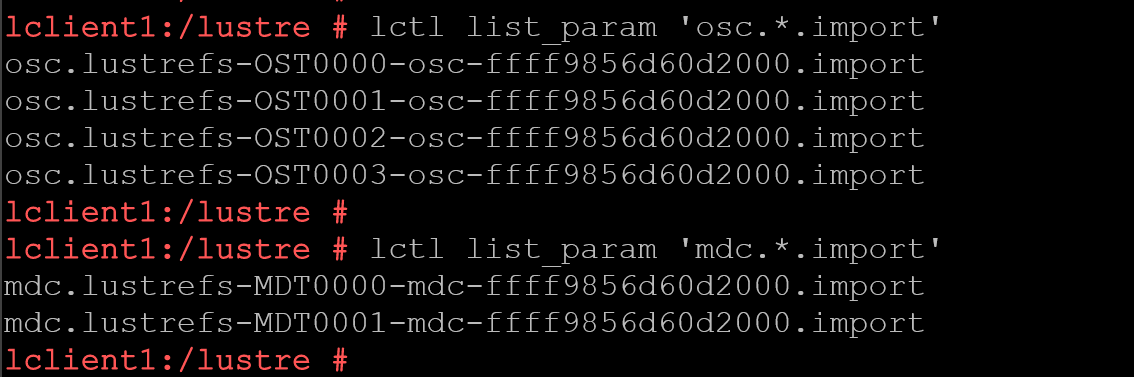
Then retrieve them:
lctl get_param 'osc.*.import'
lctl get_param 'mdc.*.import'
The output can be verbose, but connection states, recovery activity, disconnections, and repeated attempts to reconnect are valuable during an incident.
Note: Use lctl get_param freely for observation, but treat lctl set_param differently. Changing runtime parameters without understanding their scope can affect client behavior or filesystem operations.
Test LNet Connectivity with lctl ping
Lustre communication uses LNet. To test basic reachability to a Lustre Network Identifier (NID), run:
lctl ping 10.20.30.40@tcpOn newer Lustre environments, lnetctl also provides an LNet ping command:
lnetctl ping 10.20.30.40@tcpIn Multi-Rail environments, keep in mind that LNet peer selection can involve another peer interface unless the source is explicitly constrained where supported.
An InfiniBand environment may use a NID such as:
lctl ping 10.20.30.40@o2ibAlways use the exact NID configured in your cluster.
A successful lctl ping confirms basic LNet communication to that NID. It does not prove that every Lustre service on the remote host is healthy, but it confirms that the LNet path is responding.
A failed test directs the investigation toward:
- Network interface state;
- LNet configuration;
- Incorrect NIDs;
- Routing problems;
- Firewall rules;
- Remote node availability;
- InfiniBand or Ethernet connectivity.
Where available, display local LNet configuration with:
lnetctl net show
Inspect known peers with:
lnetctl peer show | less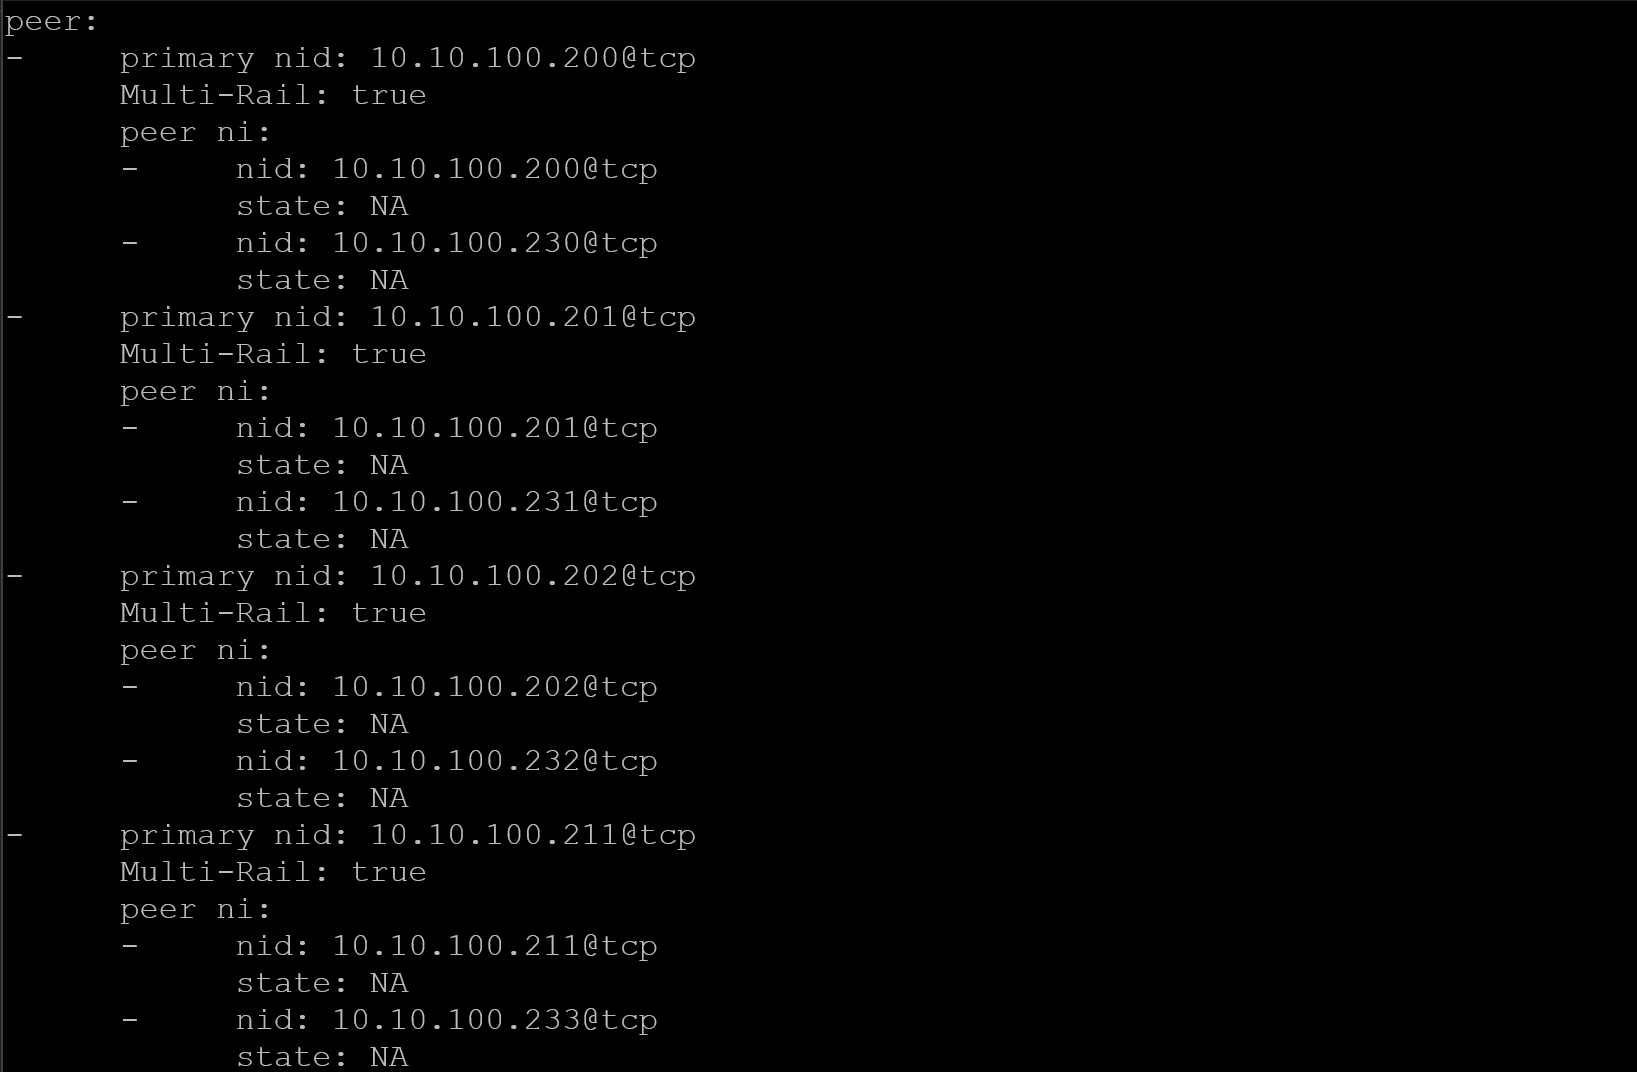
These read-only commands help confirm which networks and peers are visible from the node.
Monitor Kernel Messages During an Incident
Lustre reports many connection, recovery, timeout, and target errors through the kernel log.
Follow new messages in real time:
journalctl -kfFilter for common Lustre components:
journalctl -kf | grep -Ei 'lustre|lnet|osc|mdc'
Another option is:
dmesg -Tw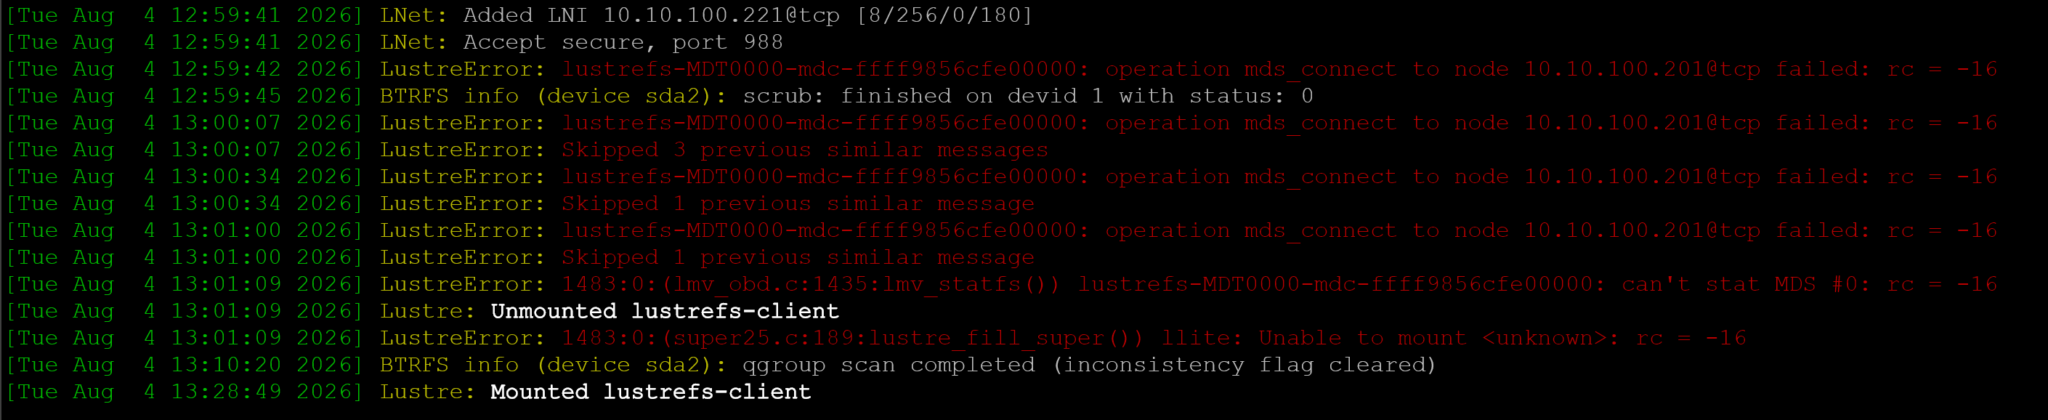
Watch for:
- Connection timeouts;
- Client evictions;
- Recovery messages;
- Unavailable MDTs or OSTs;
- Repeated reconnect attempts;
- LNet errors;
- Input/output failures.
Record the timestamp, hostname, target name, and affected operation. A report stating that OST0003 repeatedly disconnected at a specific time is far more useful than saying that the filesystem was slow.
A Practical First-Level Checklist
When a user reports that Lustre is unavailable or behaving incorrectly, start with:
findmnt -t lustre
lfs df -h /lustre
lfs df -i /lustre
lfs getname /lustre
lctl dl
journalctl -k --since "15 minutes ago" | grep -Ei 'lustre|lnet'
For a problem affecting one file:
lfs getstripe /lustre/path/to/fileFor a suspected OST issue:
lfs osts /lustre
lfs find /lustre/relevant-directory --ost TARGET_INDEX
For a suspected network path:
lctl ping TARGET_NIDBuilding a Repeatable Lustre Troubleshooting Routine
Lustre becomes much easier to troubleshoot when the investigation is divided into observable layers: mount state, metadata and storage capacity, file layout, target visibility, client device state, LNet connectivity, and kernel messages.
Commands such as lfs, lctl, lnetctl, findmnt, and journalctl do not replace deeper Lustre diagnostics, but they provide enough information to narrow the failure domain before disruptive changes are made.
The objective of a first-level investigation is therefore not to change the filesystem immediately. It is to determine whether the evidence points to the client, metadata services, an OST, LNet, or the underlying storage and network infrastructure.
External References
-
Lustre Software Release 2.x — Operations Manual
Official Lustre administration manual covering client and
server operations,
lfs,lctl, file layouts, OST pools, LNet, monitoring, recovery, and filesystem troubleshooting. - Lustre Day-to-Day Operations Practical Lustre reference for routine filesystem health checks, MDT and OST capacity, server status, LNet state, mounting, and common administrative operations.
-
Understanding Lustre Internals
Technical overview of Lustre utilities and internal components,
including common uses of
lfs df,lfs find,getstripe, and other filesystem inspection tools. -
Configuring Lustre File Striping
Official guidance for inspecting and configuring Lustre file
layouts with
lfs getstripeandlfs setstripe, including directory defaults and OST placement. - Lustre Striping Best Practices Guidance for choosing stripe counts and sizes and avoiding unnecessary wide striping that can add overhead without improving workload performance.
- Creating and Managing Lustre OST Pools Official reference for listing and managing OST pools and associating Lustre file or directory layouts with specific pools.
-
Lustre Health Checks
Lustre health-check reference covering
health_check, target capacity, exports, LNet networks, peer health, and common runtime parameters. - Lustre Quick Start Guide Practical reference for Lustre client mounting, LNet configuration, filesystem validation, file layout checks, and common first-level troubleshooting tasks.
