

Slurm nodes and partitions are among the first components I check when monitoring or troubleshooting an HPC cluster.
The sinfo command is one of the first tools I use to understand the current state of a Slurm cluster. It provides a quick view of partitions, compute nodes, node states, time limits, and unavailable resources.
In this guide, I will show how to read the default sinfo output, switch to a node-oriented view, identify unavailable nodes, and display the reason associated with DOWN, DRAINED, or similar states.
If you want to build an environment where these commands can be tested, see Setting Up a Slurm Cluster in a Lab: Practical Deployment Guide.
sinfo
Definitely, the “sinfo” command is one of the most important and useful commands for any Slurm administrator. This command displays partitions and node states:
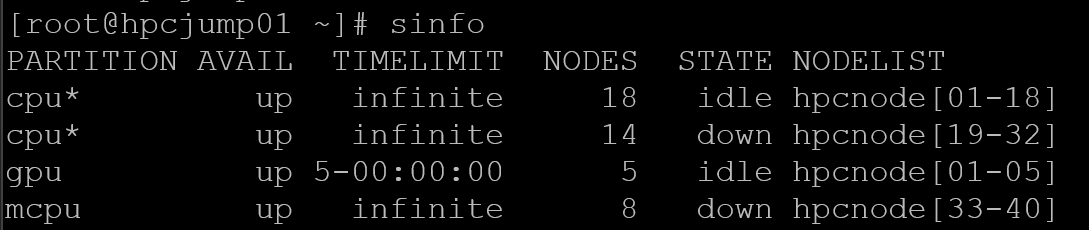
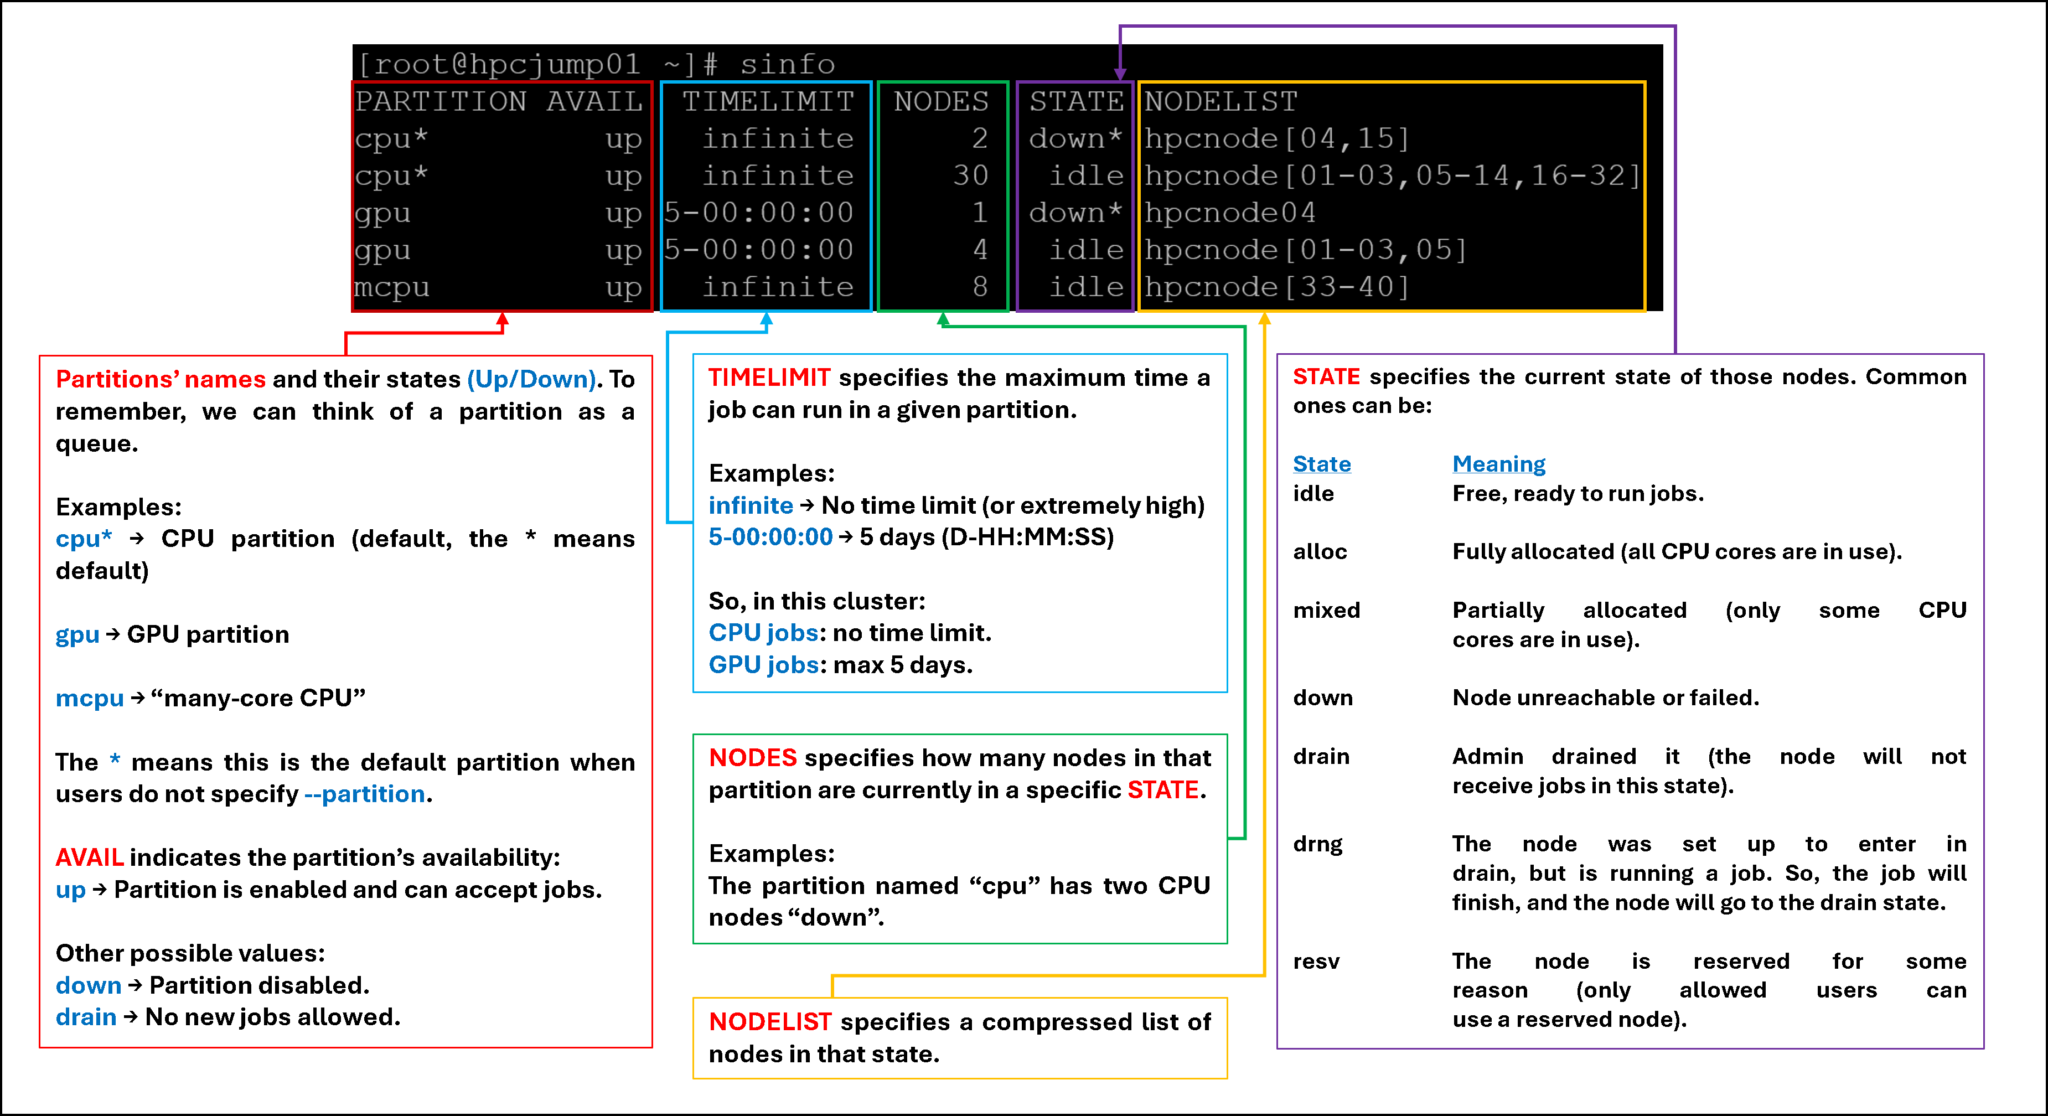
The default output is partition-oriented and commonly includes:
| Field | Meaning |
|---|---|
PARTITION | Slurm partition name |
AVAIL | Whether the partition is available for scheduling |
TIMELIMIT | Maximum job time configured for the partition |
NODES | Number of nodes represented by that row |
STATE | Current node state |
NODELIST | Nodes matching that partition/state combination |
A * after the partition name identifies the default partition used when a job does not explicitly request another partition.
As we can see, the “sinfo” command displays extensive information about the existing Slurm partitions. So, let’s break it down to provide more details:
View Slurm Information by Node
By default, sinfo groups information by partition and state.
To switch to a node-oriented view:
sinfo -NFor more details:
sinfo -N -lThis is useful when you want to inspect individual compute nodes instead of grouped partition information.
A node can belong to more than one partition, so the same node may appear on multiple lines when using -N. The SchedMD documentation explicitly describes this behavior.
Get a Partition Summary
For a compact overview:
sinfo -sThis summarizes nodes in the format:
allocated / idle / other / totalIt is useful when you want a quick health view of each partition without listing every node state separately.
sinfo -R (or –list-reasons)
As we showed earlier, the “sinfo” command (without any options) displays the partitions and node states. This includes all possible states (good or bad, from the Slurm administrator’s perspective :-)).
The “sinfo -R” command lists reasons nodes are in the down, drained, fail, or failing state. When nodes are in these states, Slurm supports the inclusion of a “reason” string by an administrator. This option will display the first 20 characters of the reason field and a list of nodes with that reason for all nodes that are, by default, down, drained, draining, or failing.
Let’s explore a possible situation that a Slurm administrator can face:
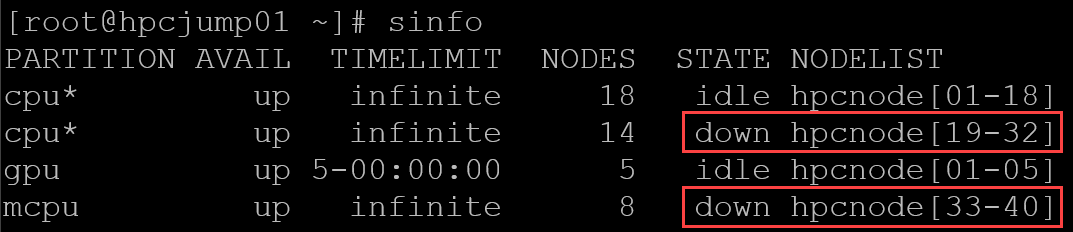
- As shown in the following image, the “sinfo” command reports many nodes in a “down” state.
- These nodes are in a “down” state and are distributed (or part of two partitions: cpu and mcpu).
- But, we cannot see the reason why the nodes are in “down”:
So, with “sinfo -R”, we can see the field “reason”, indicating the reason for the nodes is in the current state:

Note: To remember, by default, the field “reason” displays only the first 20 characters. To customize the number of characters to see, we can use the “sinfo -R” with the option “-o”, as we can see in the following picture:

So, now the field “reason” is readable, and we can see the full reason message!
Let’s break the used command down:
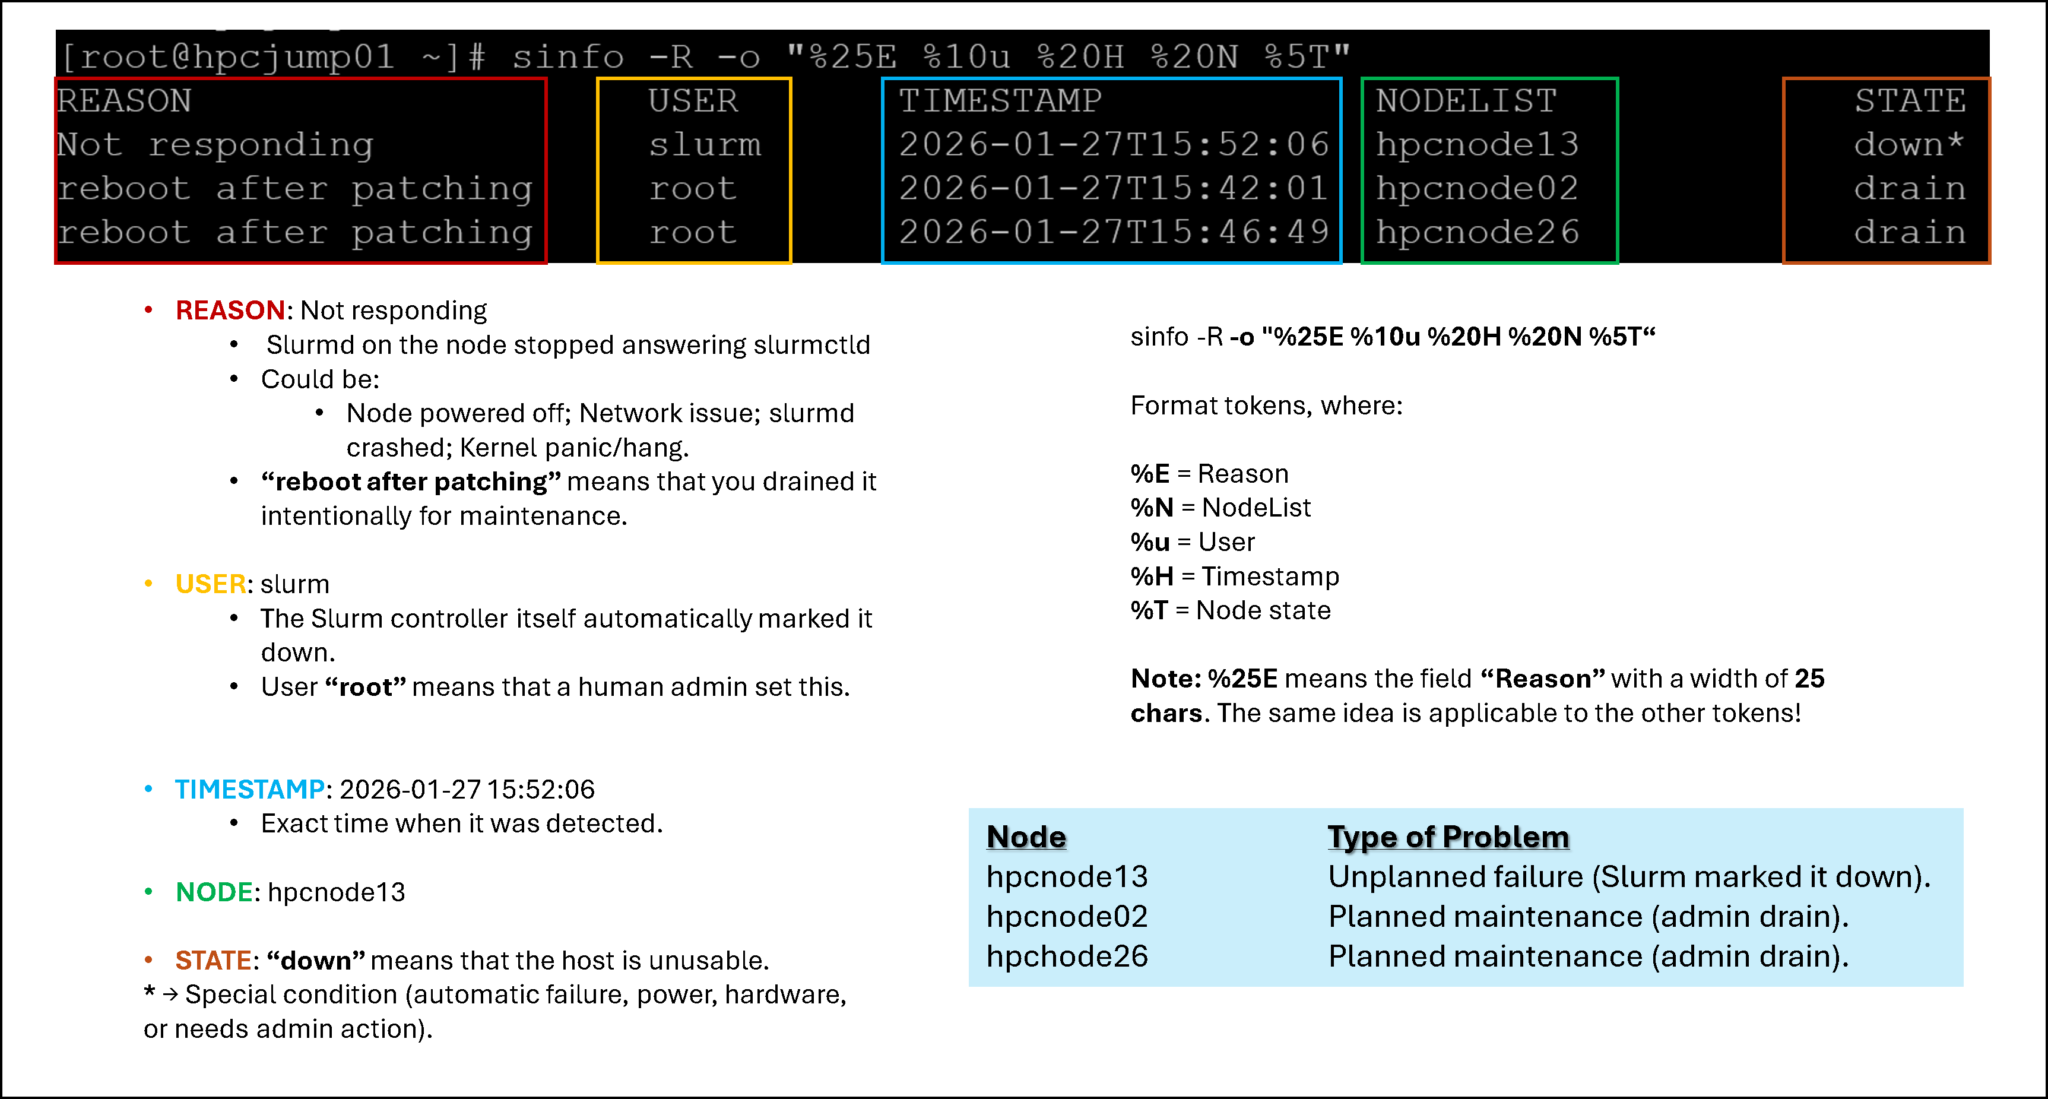
sinfo -R -o "%30E %10u %20H %40N %5T"Format tokens, where:
%E = Reason associated with the unavailable node
%u = User who set the reason
%H = Timestamp when the reason was recorded
%N = Node list
%T = Extended node state
Note: %30E requests a minimum display width of 30 characters for the Reason field, which makes longer reason messages easier to read than the default sinfo -R presentation.
Let’s break the “sinfo-R” down:
From Node Reason to Troubleshooting
Once sinfo -R identifies an unavailable node and its recorded reason, use:
scontrol show node hpcnode40to inspect the complete node information before making changes.
For example, a reason such as:
Node unexpectedly rebootedtells us where the investigation should begin, but it does not mean that the node should immediately be resumed.
Depending on the reason, the next checks may include:
- node reachability;
slurmd;- MUNGE;
- controller communication;
- configuration mismatches;
- filesystems;
- Prolog/Epilog;
- hardware or GRES devices.
For a complete node-recovery workflow, see Slurm Node Is DRAINED: How to Find the Exact Reason.
Inspect a Specific Partition in Detail
sinfo is ideal for a quick overview, but scontrol provides more detailed information about a specific partition.
For example:
scontrol show partition cpuThis can show settings such as:
PartitionName
Default
MaxTime
Nodes
State
TotalCPUs
TotalNodes
OverSubscribe
AllowAccounts
AllowGroups
For a specific node:
scontrol show node hpcnode40scontrol is therefore a useful companion to sinfo: use sinfo for the cluster overview and scontrol show when you need detailed information about one object. The official SchedMD documentation defines scontrol specifically as a tool to view or modify nodes, partitions, jobs and other Slurm objects.
Turning Slurm Status into Useful Information
sinfo provides a fast way to understand how a Slurm cluster looks from the scheduler’s perspective. The default view summarizes partitions and node states, while options such as -N, -s, and -R make it easier to focus on individual nodes, partition capacity, or unavailable resources.
When a node is DOWN, DRAINED, or otherwise unavailable, the recorded reason should be treated as the starting point of the investigation rather than the final diagnosis. scontrol show node can then provide the additional details required before any recovery action is taken.
Using these commands together makes it much easier to move from a general cluster overview to a focused troubleshooting workflow.
External References
- Slurm sinfo Documentation Official SchedMD reference for viewing Slurm partitions, compute nodes, node states, unavailable-node reasons, custom output formats, and node-oriented cluster information.
- Slurm scontrol Documentation Official command reference for inspecting detailed information about Slurm nodes, partitions, jobs, reservations, and overall cluster configuration and state.
-
Slurm Quick Start User Guide
SchedMD introduction to common Slurm commands and the use of
sinfoto identify partitions, node availability, default partitions, and cluster state. - Slurm Job and Node State Codes Official reference for interpreting Slurm state codes and state flags encountered while monitoring cluster resources.
- slurm.conf Configuration Reference Complete SchedMD reference for node and partition definitions, availability, time limits, resource configuration, access controls, scheduling behavior, and other cluster settings.
