

A Slurm node DRAINED state means the scheduler has intentionally prevented a compute node from receiving new jobs. This usually happens because Slurm, a health-check mechanism, or a cluster administrator identified a condition that makes the node unsuitable for additional workloads.
Seeing drain or drained in sinfo does not immediately tell you what failed. The node may have a hardware problem, a full filesystem, an invalid Slurm configuration, a failed Prolog or Epilog, or simply have been drained manually for maintenance.
Fortunately, Slurm normally stores a reason with the node state. By combining sinfo, scontrol, system logs, and a few Linux checks, an administrator can usually determine exactly why the node was drained before deciding whether it is safe to return it to service.
What Does DRAINED Mean in Slurm?
Slurm uses node states to determine whether compute resources can receive new jobs.
A node in the DRAINED state is unavailable for new job allocations. Slurm distinguishes this from DRAINING: a draining node still has one or more jobs running, but the scheduler will not assign additional jobs to it. Once the remaining jobs finish, the node transitions to DRAINED.
For example:
sinfo -Nmight return:
NODELIST   NODES PARTITION STATE
node01         1   compute idle
node02         1   compute drain
node03         1   compute alloc
The important point is that DRAINED is not itself the root cause.
It is the state Slurm uses to keep the node out of normal scheduling while an underlying condition is investigated or maintenance is performed.
Start with sinfo -R
The quickest way to investigate drained nodes is:
sinfo -RNote: sinfo -R is designed as a quick cluster-wide view and displays only the first 20 characters of the recorded reason by default. Always follow it with scontrol show node <node> when you need the complete reason, timestamp, and node state.
The -R option displays nodes that are unavailable together with the reason associated with their state.
Example:
REASON                     USER      TIMESTAMP           NODELIST
Low socket*core*thread      slurm     2026-08-09T08:42    node02
Or you might see something similar to:
REASON                     USER      TIMESTAMP           NODELIST
Epilog failure              root      2026-08-09T09:15    node07
tmp filesystem full         admin     2026-08-09T09:34    node12
This is often enough to determine the direction of the investigation.
sinfo can report reasons for unavailable nodes, making sinfo -R one of the most useful first commands when troubleshooting DOWN, DRAIN, or related node conditions.
If the cluster has many drained nodes, the command also provides a fast way to identify whether several systems share the same failure.
Inspect the Node with scontrol
The next command should normally be:
scontrol show node node02A simplified output might look like:
NodeName=node02 Arch=x86_64 CoresPerSocket=16
   CPUAlloc=0 CPUEfctv=32 CPUTot=32 CPULoad=0.04
   RealMemory=128000 AllocMem=0 FreeMem=121340
   State=IDLE+DRAIN
   Partitions=compute
   BootTime=2026-08-01T07:14:32
   SlurmdStartTime=2026-08-01T07:16:05
   LastBusyTime=2026-08-09T08:38:21
   Reason=Low socket*core*thread count [slurm@2026-08-09T08:42:11]
The most important fields during the initial investigation are:
State=
Reason=
State tells you the scheduler’s current view of the node, while Reason provides the explanation recorded when the state changed.
You should also examine CPU counts, memory, configured features, GRES resources, boot time, and SlurmdStartTime. These fields can expose differences between what Slurm expects and what the operating system is actually reporting.
DRAIN Versus DOWN
DRAIN and DOWN should not be treated as interchangeable.
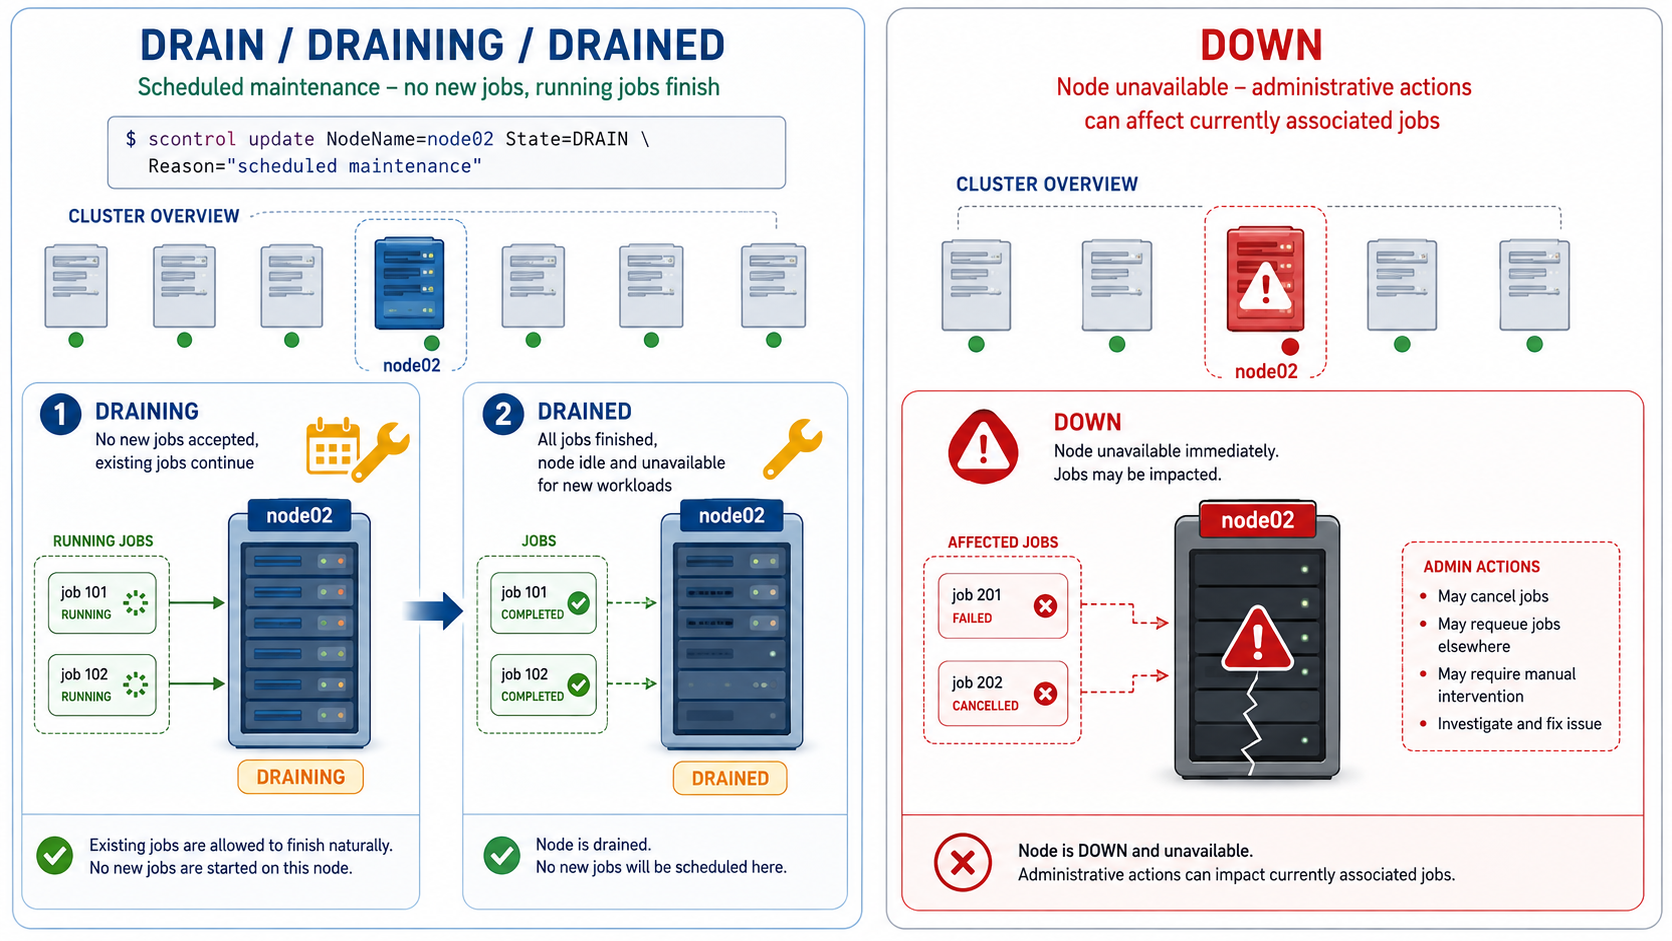
Setting a node to DRAIN prevents new jobs from starting on it while allowing existing jobs to finish normally. If jobs are still running, the node appears as DRAINING; after the final job completes, it becomes DRAINED.
Setting a node to DOWN is more disruptive. Slurm stops running and suspended jobs associated with that node and makes the resource unavailable for new work.
For planned maintenance where existing jobs should finish first, DRAIN is therefore normally the safer administrative action.
This distinction matters during maintenance.
If a compute node requires work but current jobs are healthy, an administrator may intentionally run:
scontrol update NodeName=node02 State=DRAIN Reason="scheduled maintenance"If jobs are still running, the node becomes DRAINING.
Once they finish, it becomes DRAINED.
So not every drained node represents an unexpected failure.
Configuration Mismatches
When the reason indicates a CPU, socket, core, memory, or registration mismatch, compare what Slurm expects with what the compute node actually reports.
First inspect Slurm’s current view of the node:
scontrol show node node02Then, on the affected compute node:
slurmd -Cslurmd -C reports the hardware configuration detected by slurmd, rather than the values configured in slurm.conf. Compare this output with the NodeName= definition used by your cluster.
For example, you might discover that Slurm expects:
NodeName=node02 CPUs=32 Boards=1 SocketsPerBoard=2 \
CoresPerSocket=8 ThreadsPerCore=2 RealMemory=128000
If the cluster uses a traditional configuration file, inspect the corresponding NodeName entry in slurm.conf. In a configless environment, compare it with the configuration distributed by the controller.
Check slurmd on the Compute Node
If the configuration looks correct, verify the Slurm node daemon:
systemctl status slurmdThen check recent messages:
journalctl -u slurmdFor the current boot:
journalctl -u slurmd -bDepending on the cluster configuration, slurmd may also write to a dedicated log file.
For example:
grep -iE "error|drain|fail" /var/log/slurm/slurmd.logNote: The exact path depends on how Slurm logging is configured.
Look for messages related to registration failures, memory or CPU mismatches, GRES configuration, cgroups, filesystem problems, communication failures, Prolog or Epilog execution, and authentication issues.
Valuable Tip: The timestamp shown in the node’s Reason field is particularly valuable here. Use it to focus your log investigation around the moment when the node entered the drained state.
Prolog and Epilog Failures
Slurm can automatically drain a node when job lifecycle scripts fail.
Sites often configure Prolog scripts to prepare a node before a job starts and Epilog scripts to perform cleanup after a job finishes.
If a compute-node Prolog returns a non-zero exit code, Slurm drains the affected node and requeues the job. By default, the requeued job is also held unless SchedulerParameters=nohold_on_prolog_fail has been configured.
If the compute-node Epilog returns a non-zero exit code, Slurm also places the node into DRAIN.
If sinfo -R reports something similar to:
Prolog failureor:
Epilog failurefind the scripts configured on the cluster:
scontrol show config | grep -iE "Prolog|Epilog"Then test the underlying problem instead of immediately resuming the node.
Common issues include:
missing mount points
permission errors
unavailable network storage
failed cleanup operations
missing commands
incorrect environment assumptions
Important: A resume without fixing the script may simply cause the node to drain again when the next job arrives.
If an unhealthy or unresponsive compute node causes jobs to remain in the COMPLETING state, see “How to Investigate Slurm Jobs Stuck in COMPLETING State“.
Node Health Checks
Many HPC environments perform additional health checks outside normal Slurm scheduling.
Slurm supports a HealthCheckProgram that can execute periodically on compute nodes. The script itself can detect a problem and explicitly drain the node using scontrol. The Slurm configuration documentation even uses a full temporary filesystem as an example of a condition that could result in a node being drained.
A non-zero exit code from the health-check script does not by itself define the recovery action. The script is responsible for explicitly draining the node, sending an alert, or taking any other configured action.
Check whether one is configured:
scontrol show config | grep -i HealthCheckIf a health-check tool or custom script is involved, inspect its logs and configuration.
Typical checks may include:
filesystem availability
disk utilization
GPU health
network interfaces
memory errors
temperature
required mounts
local scratch space
This is important because Slurm itself may only display the reason supplied by the health-check script. The detailed diagnosis may exist elsewhere.
Check Filesystems and Local Storage
Storage problems are especially common on compute nodes.
Start with:
df -hThen check inode utilization:
df -iA filesystem can have free gigabytes while still being unable to create new files because all available inodes have been consumed.
Also verify expected mounts:
findmntIf the cluster uses NFS, Lustre, BeeGFS, or another distributed filesystem, confirm that required filesystems are accessible from the affected node.
For example:
mount | grep lustreA missing home directory, application filesystem, or scratch mount can be enough for a site health-check script to drain the server.
Note: If the affected cluster uses Lustre and you need a refresher on how its MDS, OSS, MDT, OST and client components interact, see “Getting Started with Lustre File System“.
Investigate Hardware and Kernel Problems
If Slurm itself appears healthy, investigate the operating system.
Useful commands include:
dmesg -T | tail -100and:
journalctl -p err -bLook for memory errors, disk I/O failures, network interface problems, filesystem errors, PCIe faults, GPU errors, or kernel events occurring around the drain timestamp.
On GPU nodes, also verify the accelerator stack.
For NVIDIA systems, for example:
nvidia-smiA GPU node can appear perfectly healthy from a CPU perspective while one accelerator has disappeared from the operating system or failed to initialize. If Slurm’s GRES configuration expects that GPU, the mismatch can prevent the node from returning to normal service.
Manually Drained Nodes
Sometimes the reason is much simpler.
An administrator may have intentionally executed:
scontrol update NodeName=node02 State=DRAIN Reason="memory replacement"Slurm allows administrators to attach a custom reason when changing the node state.
Running:
scontrol show node node02may reveal:
Reason=memory replacement [admin@2026-08-09T10:12:08]The username and timestamp immediately tell you who initiated the change and when. Before resuming such a node, confirm that the maintenance activity has actually been completed.
Returning the Node to Service
Once the underlying problem has been fixed, the node can normally be returned to scheduling with:
scontrol update NodeName=node02 State=RESUMERESUME is an administrative action rather than a persistent Slurm node state.
When issued against a drained or down node, Slurm moves the node toward IDLE+NoResp and asks slurmd to register again with the controller. After a valid registration, the NoResp flag is removed and the node can return to normal scheduling.
This is why a node should always be checked again after RESUME rather than assuming that the command itself repaired the problem.
Verify the result:
sinfo -N -n node02and:
scontrol show node node02Ideally, the node should eventually show a schedulable state such as:
State=IDLEImportant: Do not treat RESUME as the fix itself. It only tells Slurm that the node may be considered for service again. If the underlying problem remains, the node may immediately or eventually return to DRAIN.
RESUME vs UNDRAIN
RESUME can move a node out of DRAIN, DRAINING, DOWN, or REBOOT toward normal registration and scheduling.
UNDRAIN only removes the drain condition; it does not change the underlying base state. For example, a node that is both DOWN and DRAINED can remain DOWN after UNDRAIN.
For this reason, use the command that matches the actual node state instead of treating UNDRAIN and RESUMEas identical.
A Practical Troubleshooting Sequence
For most incidents, the investigation can follow this order:
sinfo -RIdentify the reason.
Then:
scontrol show node <node>Inspect the complete node state and recorded message.
On the compute node:
systemctl status slurmd
journalctl -u slurmd -b
df -h
df -i
findmnt
dmesg -T | tail -100
If the reason mentions a Prolog, Epilog, health check, GRES device, or configuration mismatch, follow that path before changing the node state.
Once the actual problem has been corrected, resume the node:
scontrol update NodeName=<node> State=RESUMEand verify it again with:
sinfo -N -n <node>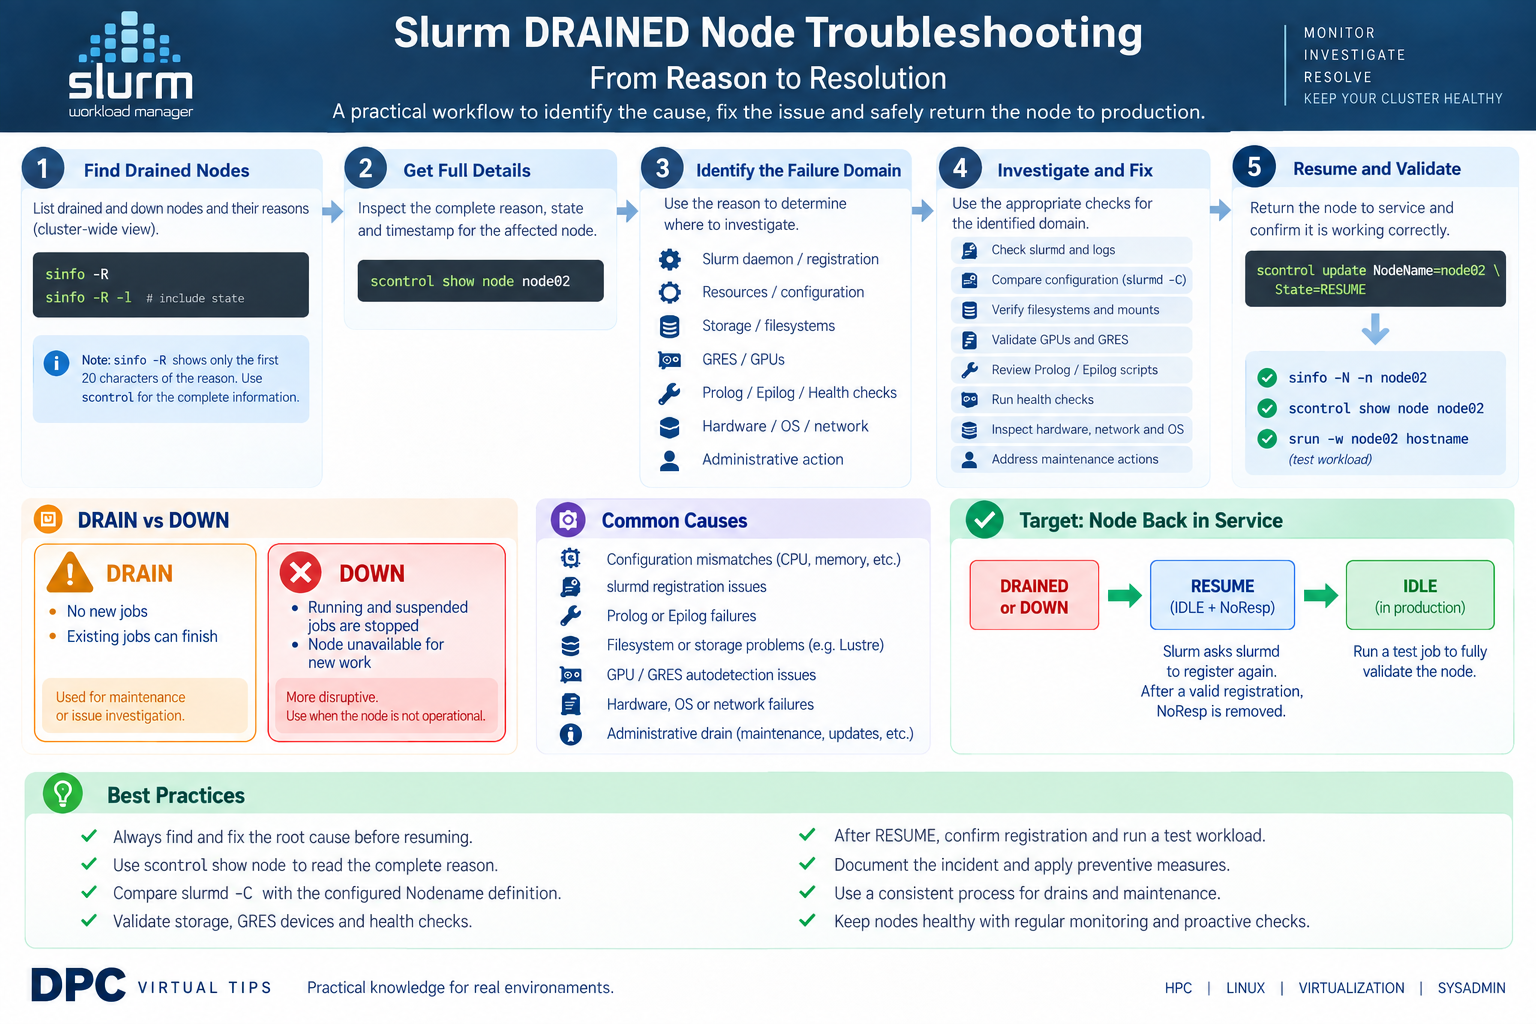
What a DRAINED Node Is Really Telling You
A DRAINED node should be treated as a symptom and a protective scheduler state, not as the problem itself.
The fastest investigations usually begin with sinfo -R, continue with the complete Reason and timestamp from scontrol show node, and then follow the evidence into the relevant failure domain — whether that is Slurm configuration, slurmd, Prolog or Epilog scripts, storage, GRES devices, hardware, or an administrator-initiated maintenance action.
Only after the underlying condition has been corrected should the node be resumed and validated with a fresh registration and, when appropriate, a small test workload.
That approach prevents the common cycle of repeatedly running State=RESUME on a node that continues to drain because the original problem was never fixed.
External References
-
Slurm sinfo Documentation
Official SchedMD reference for inspecting node and partition
states, listing drained and down nodes, and using
sinfo -Rto review node reasons. -
Slurm scontrol Documentation
Official command reference for inspecting and changing Slurm
node states, including
DRAIN,DOWN,RESUME,UNDRAIN, and node reason information. - Slurm Troubleshooting Guide SchedMD troubleshooting guidance for nodes that become unavailable, fail to respond, or register with configuration and resource mismatches.
-
Slurm Prolog and Epilog Guide
Official documentation explaining Prolog and Epilog execution,
failure handling, job requeue behavior, and conditions that
cause a compute node to enter the
DRAINstate. -
slurmd — Slurm Compute Node Daemon
Reference for the Slurm compute-node daemon, including
slurmd -Cfor reporting the hardware configuration detected directly on a compute node. -
slurm.conf Configuration Reference
Complete SchedMD reference for node definitions,
HealthCheckProgram, resource configuration, controller behavior, and other settings that can influence node registration and availability. - Slurm Generic Resource Scheduling Official guide for configuring and troubleshooting generic resources such as GPUs, including GRES allocation, autodetection, topology, and node resource reporting.
-
gres.conf Configuration Reference
SchedMD reference for GPU and other GRES device definitions,
AutoDetect, device files, core affinity, and mismatches that can leave a compute node invalid or drained.
