
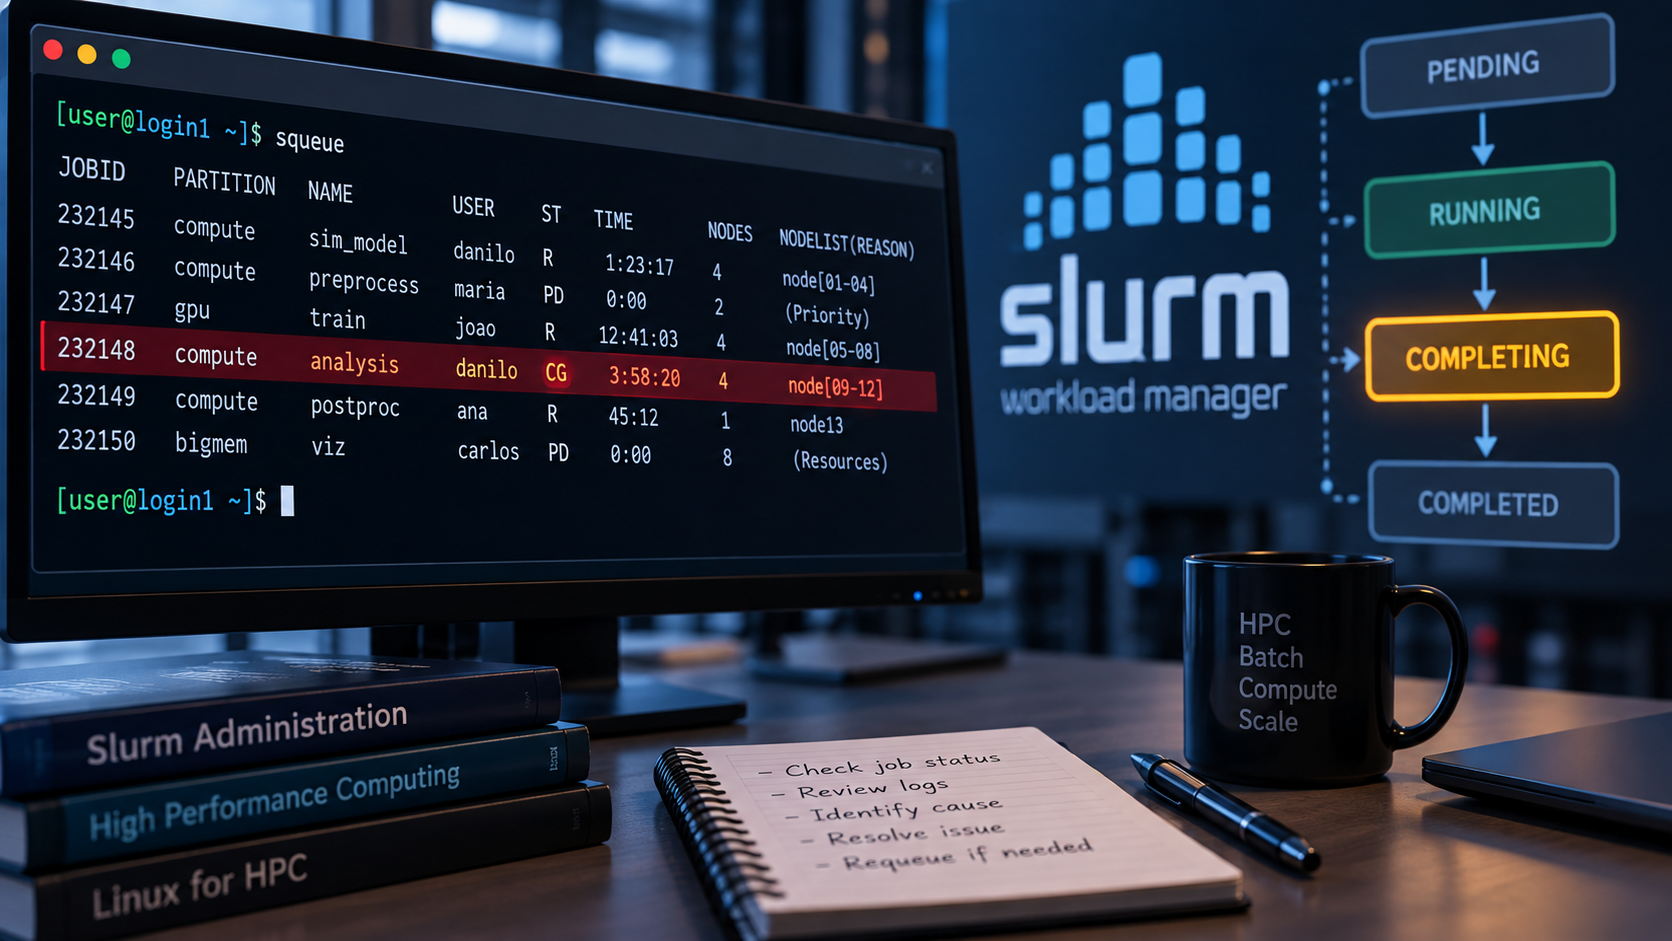
Slurm jobs stuck in COMPLETING state can indicate that one or more compute nodes have not finished cleaning up the resources associated with a workload. In a healthy Slurm-managed HPC cluster, a job normally moves from RUNNING to COMPLETING and then quickly reaches a final state such as COMPLETED, FAILED, or CANCELLED.
The COMPLETING phase is expected, but it should usually be brief. When a job remains there for several minutes or longer, Slurm may still be waiting for processes to terminate, an epilog script to finish, a filesystem operation to return, or communication with a compute node to recover.
This type of problem can also reduce cluster capacity because affected nodes may remain unavailable for new workloads while cleanup continues. A systematic investigation helps administrators determine whether the issue is related to the job, the node, storage, or the Slurm configuration before taking disruptive action.
Common Slurm Job States
Before troubleshooting a job stuck in COMPLETING, the following helps to understand the most common states a Slurm job can move through during its lifecycle.
Some of the states administrators encounter most often are:
PENDING (PD)– The job is waiting for resources, dependencies, priorities, or another scheduling condition before it can start.RUNNING (R)– The job has been allocated resources and is currently executing. In simple terms, the job is being run on the compute nodes.COMPLETING (CG)– Slurm displays this flag while the job is finishing cleanup, terminating remaining processes, running epilog tasks when configured, and releasing allocated resources.COMPLETED (CD)– The job finished successfully and returned an exit code of zero.CANCELLED (CA)– The job was cancelled by a user, administrator, or another Slurm action.FAILED (F)– The job terminated unsuccessfully, usually because of a non-zero exit condition or another execution problem (the script executed by the job was an issue, for example).TIMEOUT (TO)– The job exceeded its configured time limit.NODE_FAIL (NF)– The job ended because one or more allocated compute nodes failed.OUT_OF_MEMORY (OOM)– The job or one of its steps exceeded the available or configured memory limit.
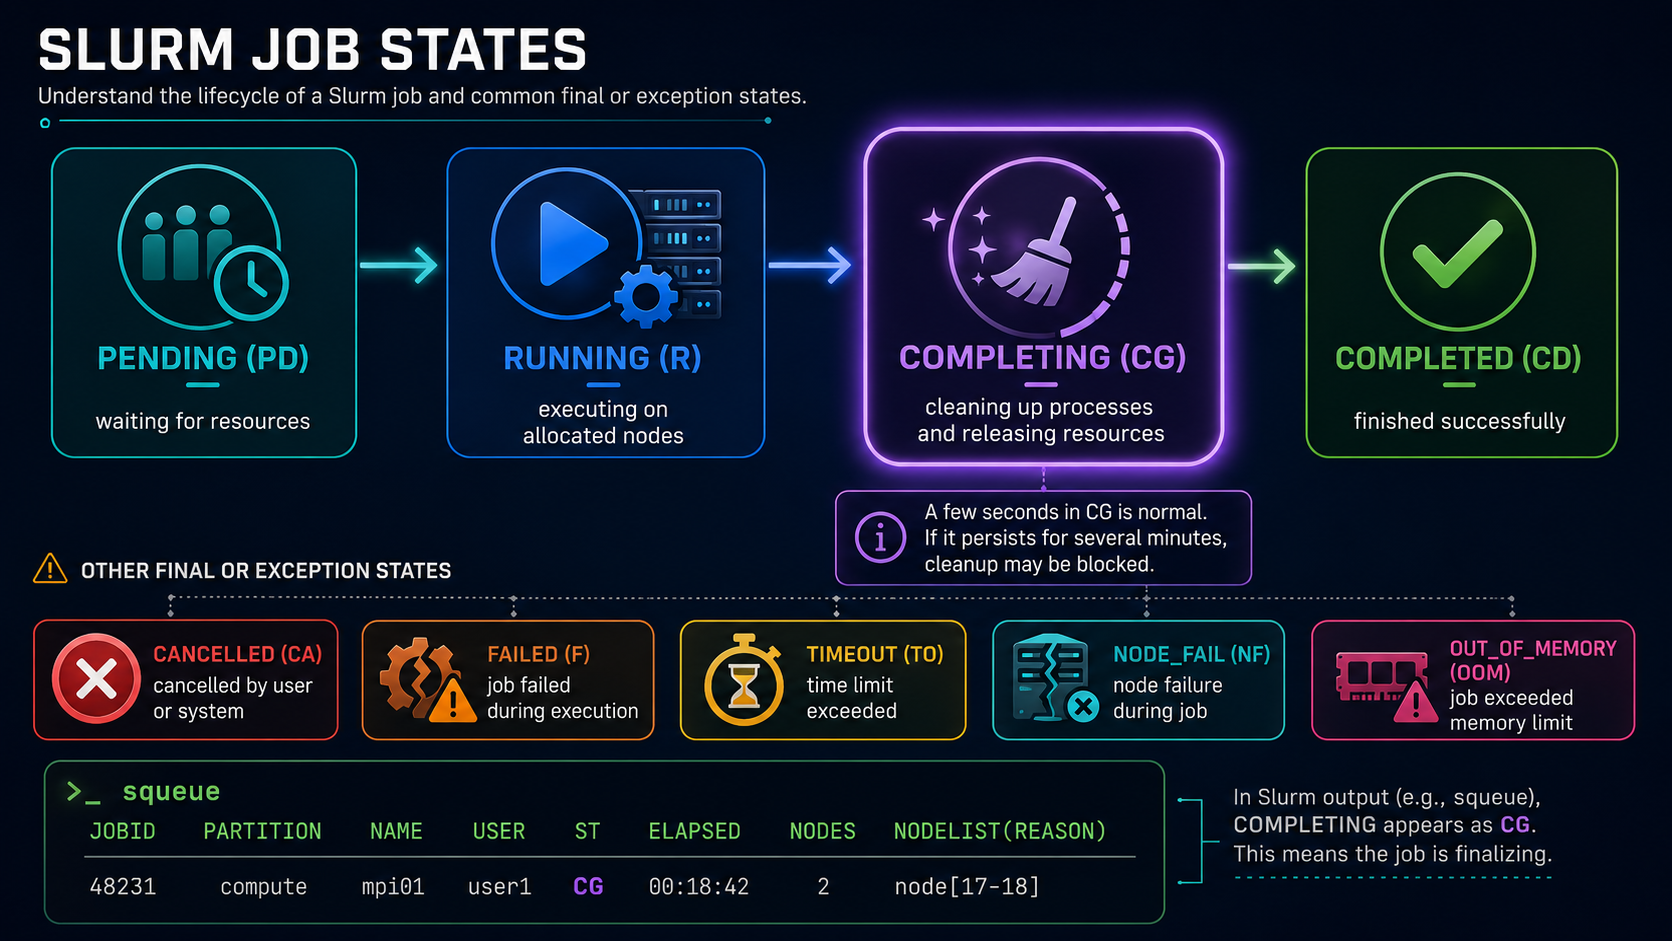
A normal lifecycle may look roughly like this:
PENDING → RUNNING → COMPLETING → COMPLETED
   PD        R          CG           CD
Not every job follows this exact path. A running job may instead become FAILED, CANCELLED, TIMEOUT, or NODE_FAIL, depending on what happens during execution.
For this article, the important transition is:
RUNNING → COMPLETING → final stateWhen the job reaches COMPLETING, the workload may already have stopped doing useful work, but Slurm still has cleanup activities to finish before the allocation can be fully released.
What COMPLETING Means in Slurm
Slurm uses the COMPLETING state while a job is being terminated and its allocated resources are released. Slurm waits until job processes are gone and required cleanup has finished before moving the job to its final state.
The state appears as CG in the default squeue output:
squeueExample:
JOBID PARTITION     NAME     USER  ST       TIME       NODES  NODELIST(REASON)
48231 compute       mpi01    user1 CG      00:18:42      2    node[17-18]
A few seconds in CG is generally not a concern (it may be considered normal). If it persists for several minutes, cleanup may be blocked (or something may have gone wrong during this phase).
For a COMPLETING job, squeue can show only the nodes that have not yet been returned to service, which helps narrow a multi-node problem to a specific compute node.
Start by Identifying the Affected Nodes
Begin with a focused view of jobs in the COMPLETING state:
squeue -t CG💡 Tip: The same idea can be used to search for jobs in other states.
To search for RUNNING and PENDING jobs, respectively:
squeue -t R
squeue -t PD
The following command provides a more focused view of jobs currently in the COMPLETING state:
squeue -t CG -o "%.18i %.10u %.9T %.10M %.6D %R"The -t CG option filters the output so that only jobs in the COMPLETING state are displayed. The -o option defines a custom output format, making it easier to see the information that matters during troubleshooting.
The format fields that we used here are:
%.18i– Job ID, displayed with a field width of up to 18 characters.%.10u– User who owns the job.%.9T– Full job state, such asCOMPLETING.%.10M– Elapsed job time.%.6D– Number of nodes allocated to the job.%R– Node list or reason information associated with the job.
For example:
JOBID              USER       STATE         TIME       NODES   NODELIST(REASON)
48231              user1      COMPLETING   00:18:42       2    node[17-18]
This custom view is particularly useful because it removes unrelated columns and immediately shows which jobs are still completing, who owns them, how long they have been running, how many nodes are involved, and which nodes may still be associated with the cleanup process.
If the problem involves one job, we can inspect it directly, using the following command – in this case, for instance, the JOB ID is 48231:
scontrol show job 48231Pay attention to fields such as:
JobState=COMPLETING
NodeList=node[17-18]
BatchHost=node17
ExitCode=0:0
Now inspect the node state:
sinfo -N -lor:
scontrol show node node17A node involved in cleanup will not receive new work until Slurm finishes processing the job.
Check Whether Processes Are Still Running
One of the most common reasons for a job to remain in COMPLETING is that a process associated with the job has not terminated.
Log in to the affected compute node (identified in the previous step) and inspect processes belonging to the user – replace “user1” with the user in your case:
ps -fu user1If you know the job ID (in this example, 48231), look for related process trees:
ps -ef --forest | grep 48231The job may have launched child processes, MPI ranks, helper programs, or scripts that did not terminate cleanly.
In cgroup-based environments, processes can remain associated with the allocation after the main application exits. When needed, inspect the process membership with:
cat /proc/<PID>/cgroup⚠️ Important: Determine what the process is doing before trying to kill it.
Look for Processes in Uninterruptible Sleep
A particularly important case is a process stuck in the D state, also called uninterruptible sleep.
Check with:
ps -eo pid,ppid,user,state,wchan:32,cmd | awk '$4=="D"'or:
ps aux | awk '$8 ~ /^D/'Processes in this state are often waiting for kernel-level I/O. They cannot necessarily be removed immediately, even with SIGKILL.
Inspect a specific process:
cat /proc/<PID>/stackIf the process is blocked on NFS, Lustre, GPFS, BeeGFS, local storage, or another filesystem, the real problem may be below Slurm (a filesystem issue, for example). Repeatedly running scancel will not fix a kernel process waiting on hung I/O.
Investigate Filesystem and Storage Problems
Filesystem trouble is a classic cause of jobs and nodes remaining in COMPLETING. The official Slurm troubleshooting guidance specifically identifies non-killable processes, frequently associated with filesystem problems, as a cause of this condition.
Start by checking kernel messages:
dmesg -T | tail -100or:
journalctl -k --since "-30 min"Look for messages involving I/O timeouts, blocked tasks, transport failures, filesystem reconnects, or storage devices.
For Lustre filesystem, for example, we can also inspect related kernel messages using dmesg filtering by lustre messages:
dmesg -T | grep -i lustreIf many compute nodes show the same behavior at once, investigate shared infrastructure rather than treating each job as an isolated failure.
Inspect slurmd on the Compute Node
The slurmd logs often provide the clearest explanation for why a job cannot leave COMPLETING.
Access the affected compute node and check the service:
systemctl status slurmdThen review recent slurmd messages:
journalctl -u slurmd --since "-30 min"If Slurm writes to a dedicated log file, inspect that instead:
tail -100 /var/log/slurm/slurmd.logSearch around the job ID – replace the job ID 48231 with your job ID:
grep 48231 /var/log/slurm/slurmd.logUseful messages may mention failed task termination, communication failures, epilog errors, job step cleanup, cgroup removal, or unkillable processes.
Also inspect the node from the controller:
scontrol show node node17A node unable to communicate correctly with slurmctld can delay completion processing.
Check Epilog Scripts
Slurm can run Epilog scripts after a job finishes on allocated nodes. A slow or hung Epilog can keep the node unavailable even after the application processes have ended.
Check the configuration to see if the Epilog is being used:
scontrol show config | grep -i EpilogYou may see:
Epilog = /etc/slurm/epilog.shReview the script carefully. Common problems include network calls, unavailable mounts, stalled DNS lookups, missing command timeouts, or cleanup commands that wait indefinitely.
Test individual operations instead of blindly executing an entire production epilog as root.
Slurm documents that node completion includes waiting for the Slurm epilog, when configured, and that epilogs or SPANK plugins can delay resource release.
Compare the Job with Accounting Data
Accounting information can help establish when the workload itself stopped and how Slurm recorded its steps.
Run:
sacct -j 48231A more useful format is:
sacct -j 48231 \
  --format=JobID,JobName,State,ExitCode,Elapsed,NodeList
We should look separately at the batch step, extern step, and application steps.
For example:
JobID          State      ExitCode
48231          COMPLETING 0:0
48231.batch    COMPLETED  0:0
48231.extern   COMPLETING 0:0
If the batch step is finished but another step remains incomplete, the problem is probably occurring during teardown rather than in the application itself.
The sacct command is designed to display job and job-step state and exit information, making it useful when comparing the main allocation with individual steps.
Understand UnkillableStepTimeout
Slurm includes configuration specifically for processes that do not terminate during cleanup phase.
Check:
scontrol show config | grep -i UnkillableRelevant settings include UnkillableStepTimeout and UnkillableStepProgram:

UnkillableStepTimeout defines how long Slurm waits for job-step processes to terminate before treating the step as unkillable. UnkillableStepProgram can be configured to run a site-specific diagnostic or remediation program when this condition occurs.
A site-specific diagnostic program can collect process states, kernel messages, and mount information before an administrator reboots the node. These settings should not be used to hide recurring infrastructure problems (they should be used, for example, to find the root cause of recurring issues).
Should You Use scancel Again?
Administrators often try:
scancel 48231when a job is already in COMPLETING.
scancel is the standard command for signaling or cancelling Slurm jobs and steps, but if termination has already started, issuing it repeatedly may not change anything.
The important question is what Slurm is waiting for. If a process is stuck in kernel I/O, the cancellation signal may already be pending. If an epilog is blocked, killing the original application is irrelevant.
🔍 So, we need to investigate those conditions first.
When a Node Must Be Drained or Rebooted
If a node contains an unkillable process, continuing to schedule work there can create additional failures.
So, in this situation, a reasonable administrative action is to drain it:
scontrol update NodeName=node17 State=DRAIN \
Reason="job stuck completing"
This action prevents new work from being assigned while you investigate.
If the root cause is a filesystem issue, correct the storage problem first when possible. In some cases, the process will immediately terminate once the blocked I/O operation returns.
When the process remains permanently stuck, a node reboot may ultimately be necessary. Slurm’s troubleshooting documentation lists fixing the filesystem or rebooting the node as remediation options for jobs and nodes stuck in COMPLETING. It also describes placing the node down and later returning it to service as another administrative path.
After recovering the node, confirm that it is healthy before returning it to service:
scontrol show node node17Then:
scontrol update NodeName=node17 State=RESUMEIf you want to know more, access “Slurm node Is DRAINED: How to Find the Exact Reason”.
A Practical Troubleshooting Sequence
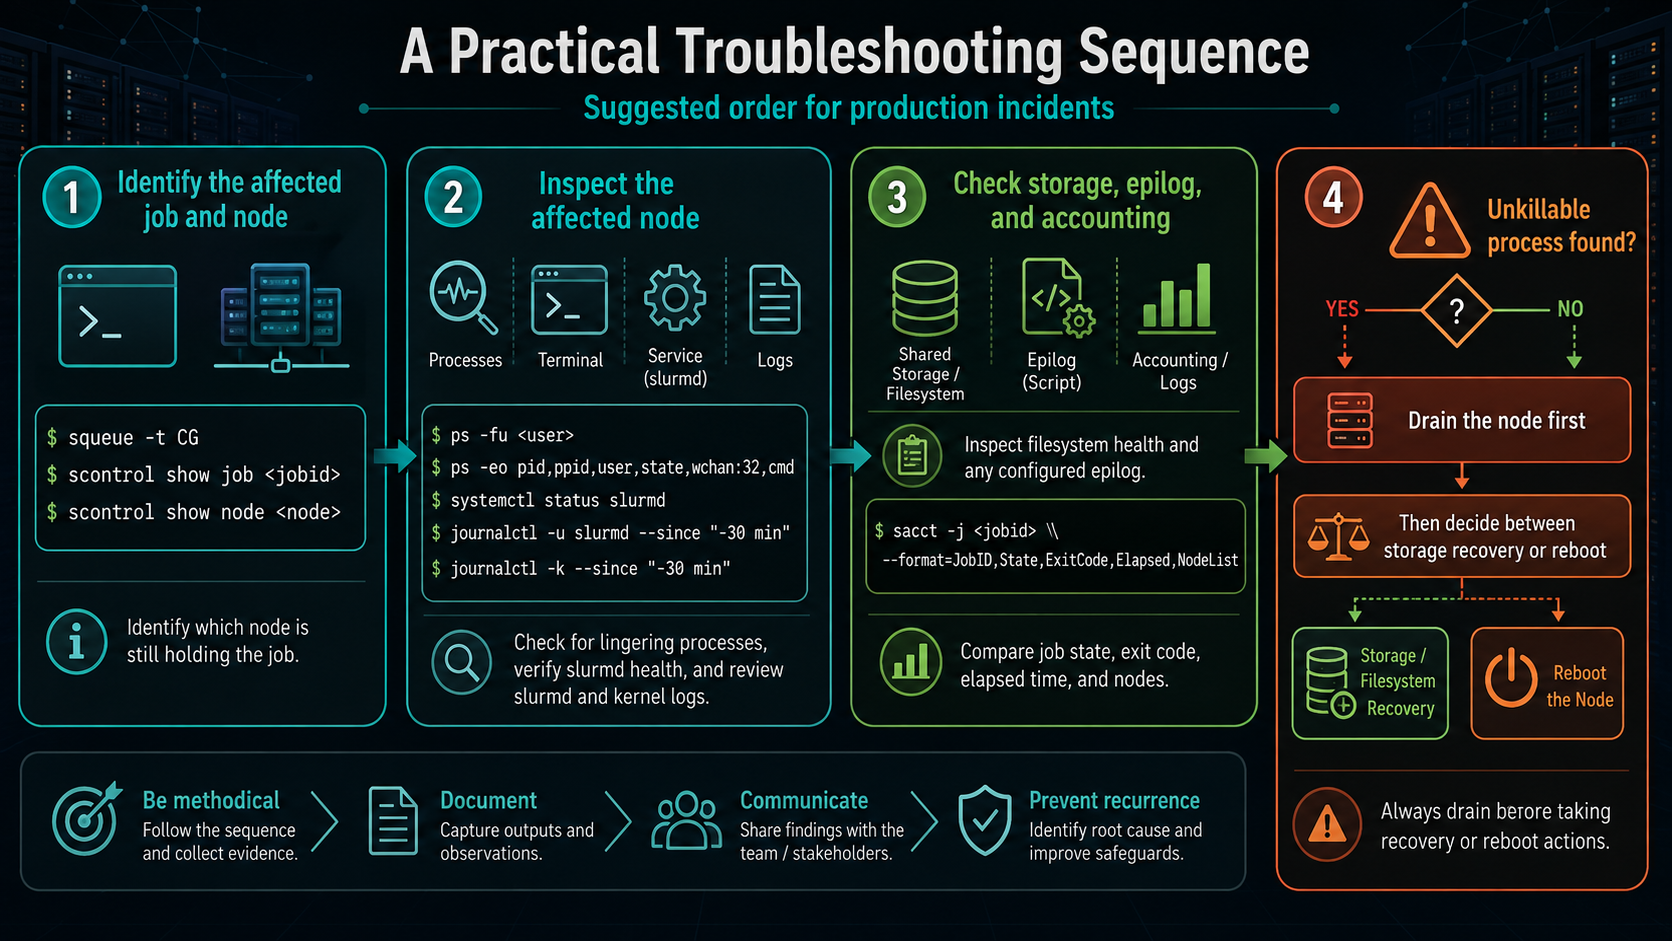
For a production incident, I recommend the following sequence to avoid unnecessary disruption:
squeue -t CG
scontrol show job <jobid>
scontrol show node <node>
Identify which node is still holding the job.
Next, on that node:
ps -fu <user>
ps -eo pid,ppid,user,state,wchan:32,cmd
systemctl status slurmd
journalctl -u slurmd --since "-30 min"
journalctl -k --since "-30 min"
Then inspect filesystem health and any configured epilog. Compare the result with:
sacct -j <jobid> \
--format=JobID,State,ExitCode,Elapsed,NodeList
If you find an unkillable process, drain the node before deciding whether storage recovery or a node reboot is required.
The Bottom Line
A job stuck in COMPLETING is therefore less a job-scheduling problem than a cleanup problem. Once you determine which node has not been released and what that node is waiting for, the investigation becomes much narrower.
In many incidents, the decisive evidence is found in a blocked process, the kernel log, slurmd, or an epilog script rather than in squeue itself.
If you are new to Slurm, start with our Introduction to Job Submission on a Slurm Cluster.
To build a hands-on environment for testing these commands, see Setting Up a Slurm Cluster in a Lab Environment.
External References
-
Slurm Troubleshooting Guide
Official SchedMD troubleshooting guidance, including jobs and nodes stuck in the
COMPLETINGstate. -
Slurm Job State Codes
Official reference for Slurm job states and flags such as
PENDING,RUNNING,COMPLETING, andCOMPLETED. - Slurm Prolog and Epilog Guide Official documentation describing when Epilog scripts run and how they can affect job and node completion.
-
slurm.conf Documentation
Reference for configuration parameters including
UnkillableStepTimeout,UnkillableStepProgram, and Epilog settings. - sacct Documentation Official reference for examining job and job-step accounting information, state, exit codes, and elapsed time.
- scancel Documentation Official documentation for cancelling and signaling Slurm jobs and individual job steps.
