

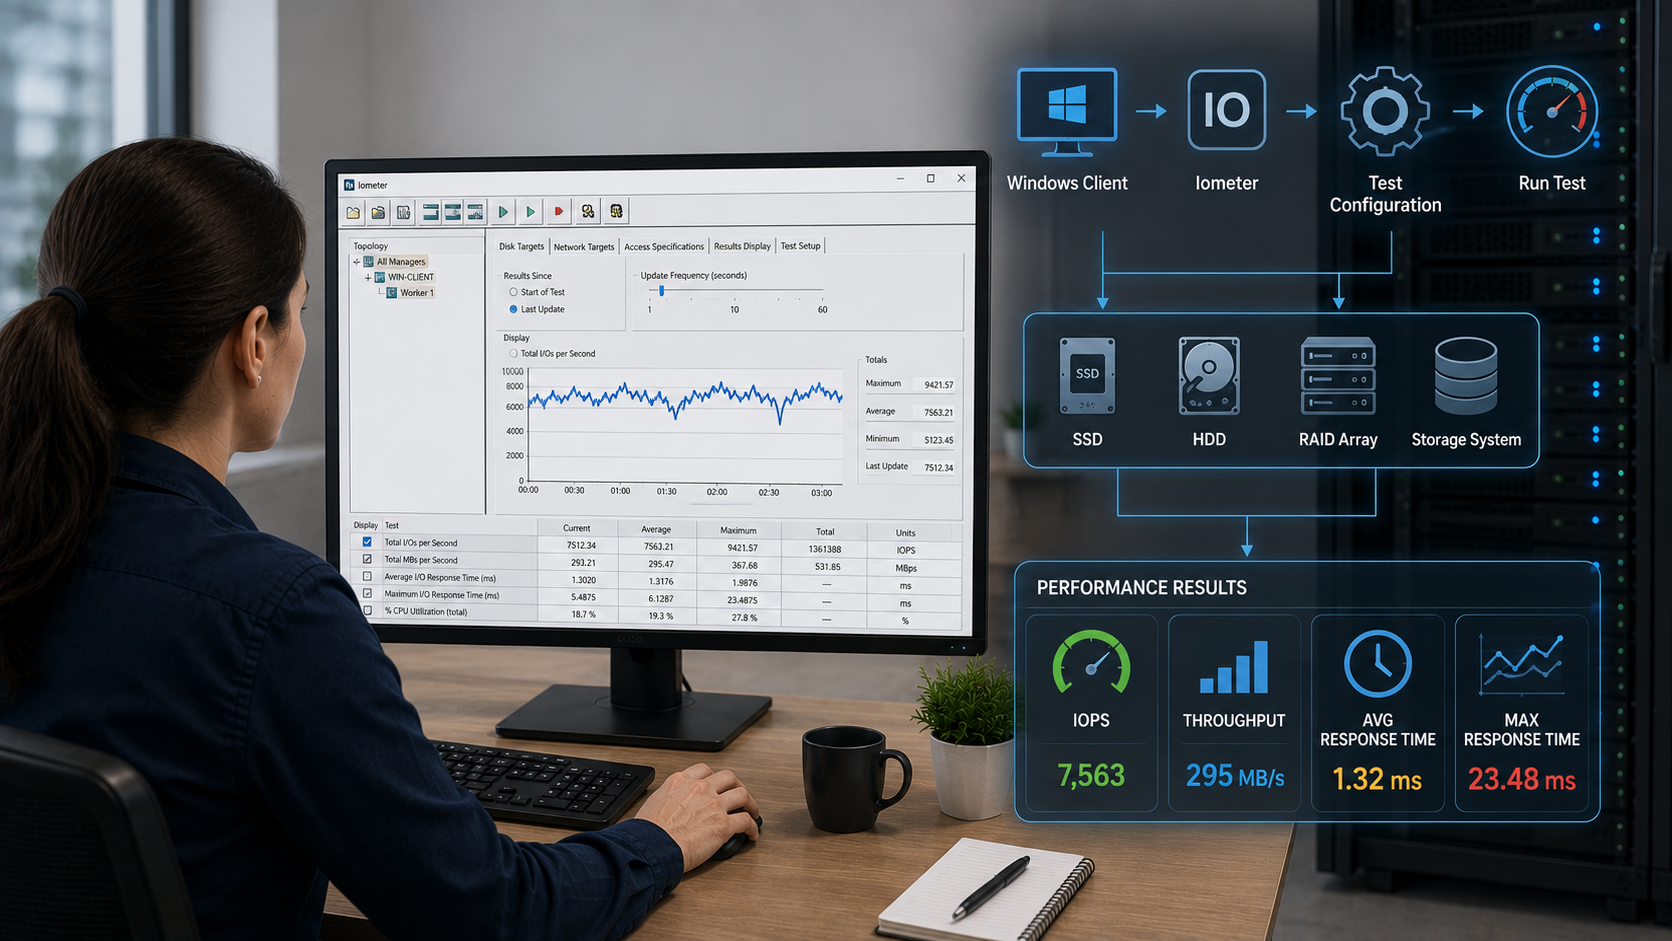
Using IOmeter on Windows is an article that shows how to measure disk IOPS with the IOmeter tools under a Windows OS.
First and foremost, What is IOmeter?
Iometer is a workload generator based on a client/server architecture. A graphical user interface, named Iometer, acts as a server coordinating the workers. The workers, named Dynamo, do the real I/O.
To download the Windows IOmeter, click here.
Why Should I Use IOmeter?
The IOmeter is a client/server tool for measuring disk input/output per second (IOPS). If you have a block device offered by a storage system and need to measure its IOPS, the IOmeter can help.
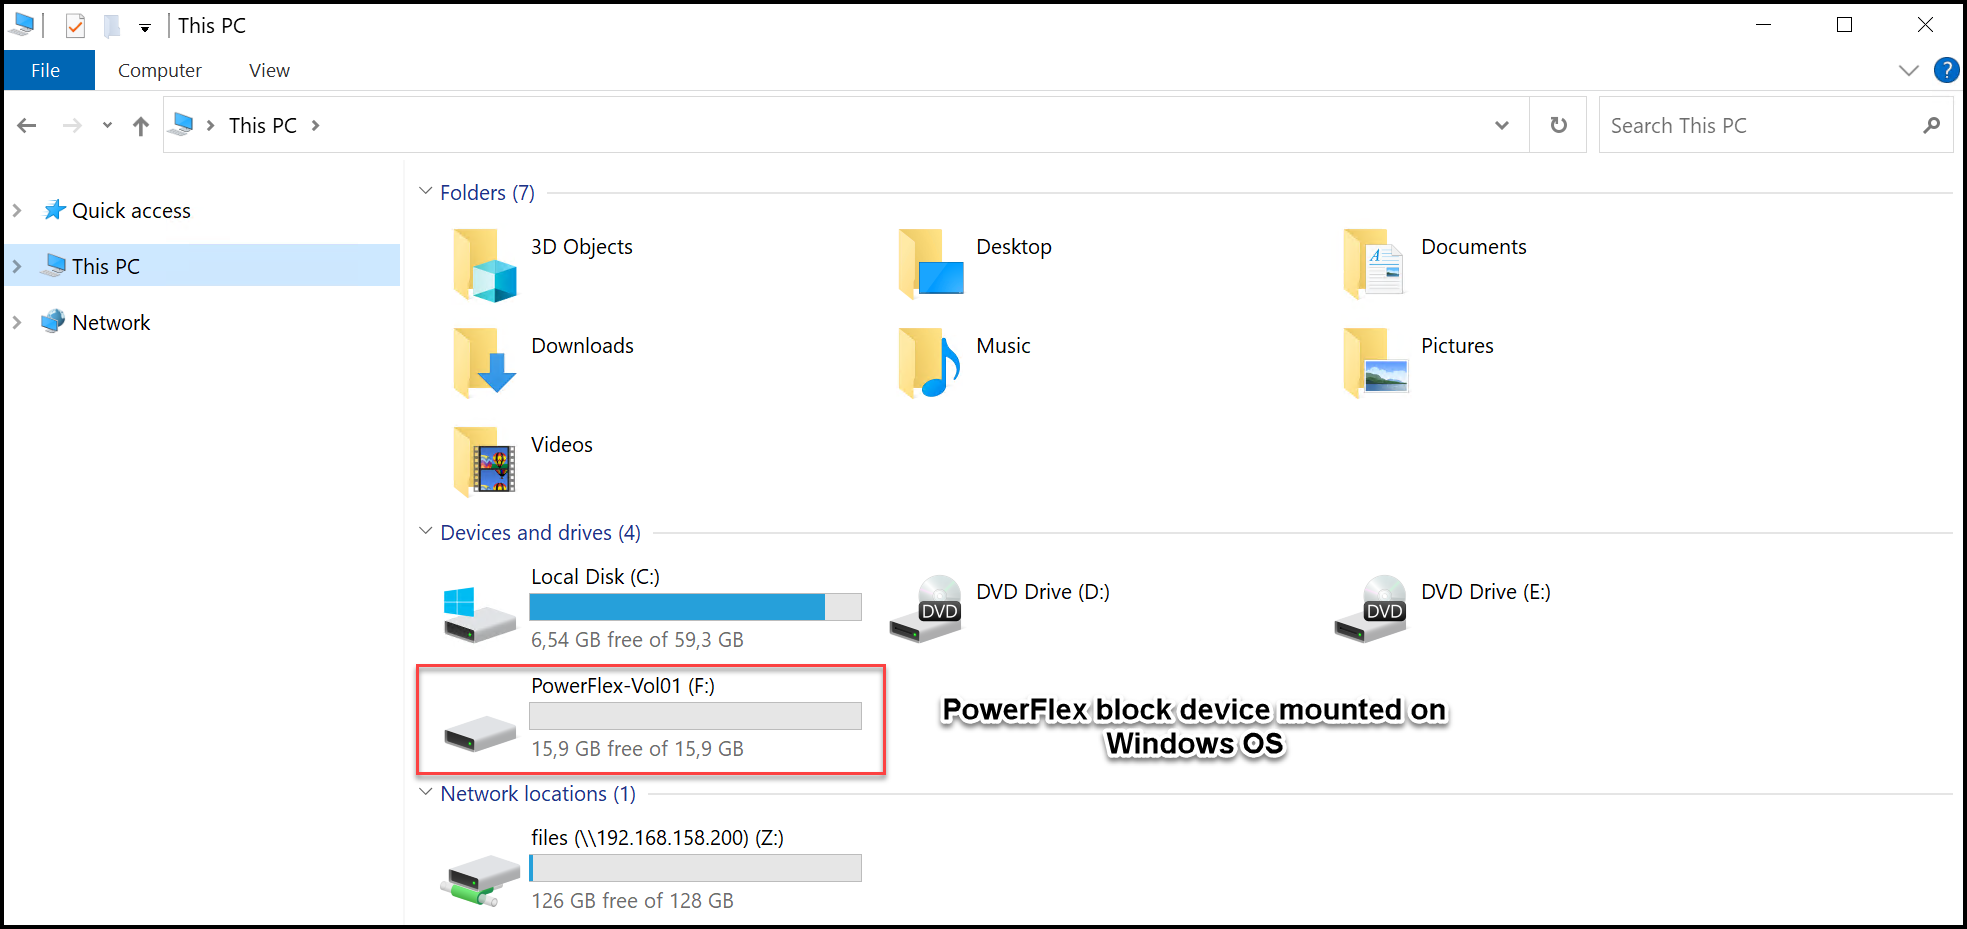
For instance, we will install the IOmeter tool on a Windows OS with a block device offered by a PowerFlex system. We will run the IOmeter using this block device to measure its performance:
Installing the IOmeter on Windows
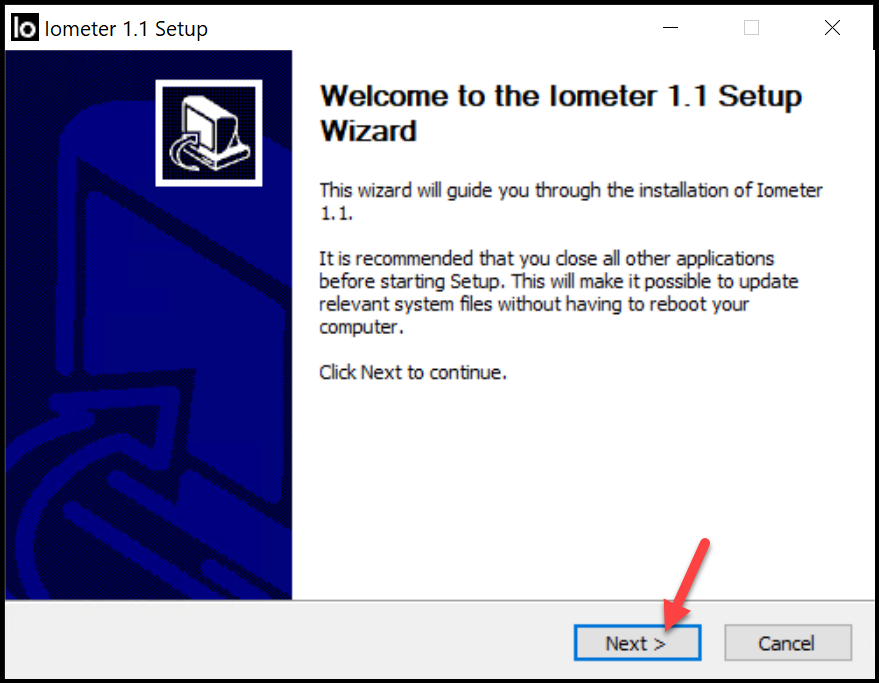
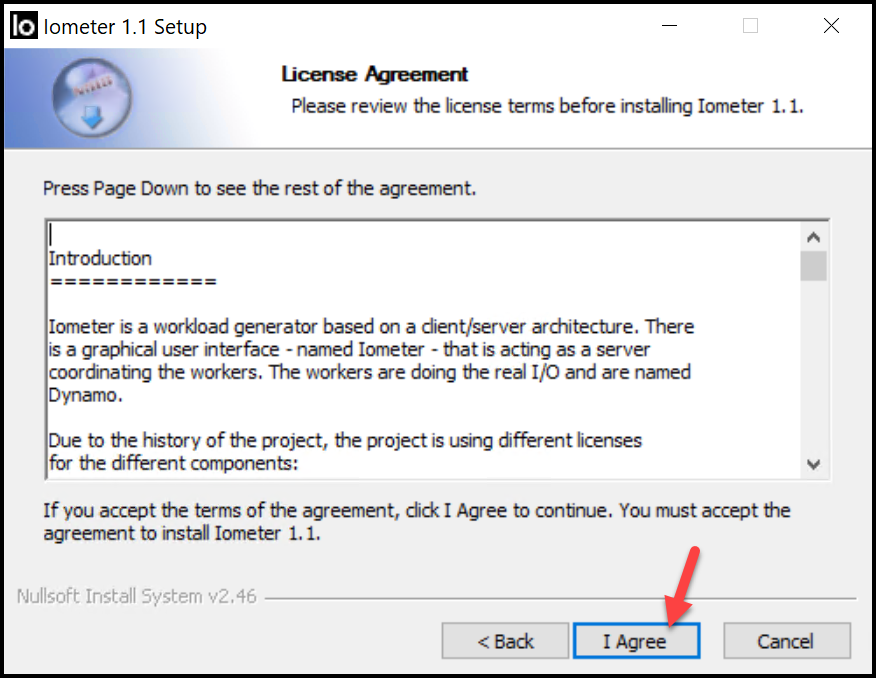
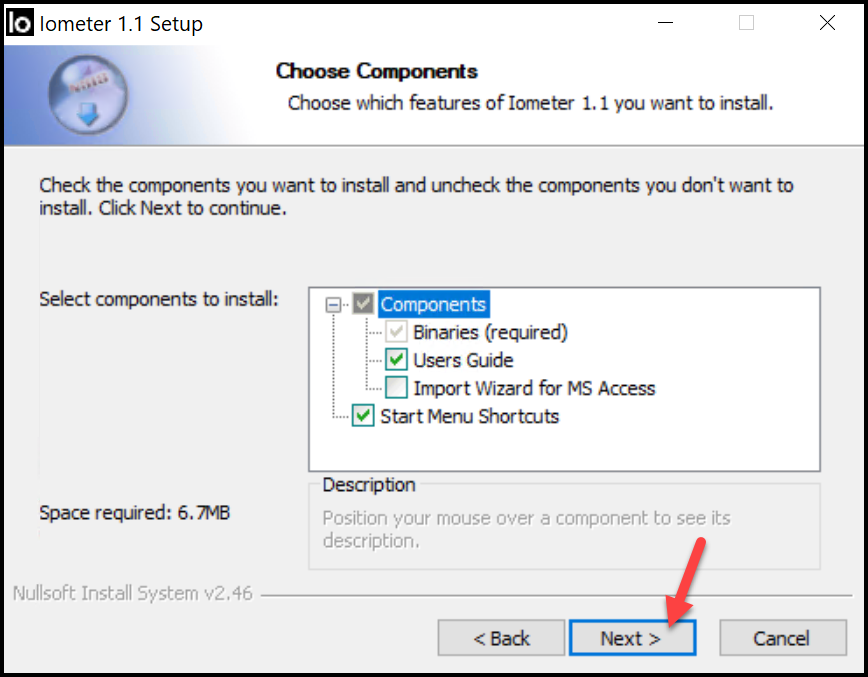
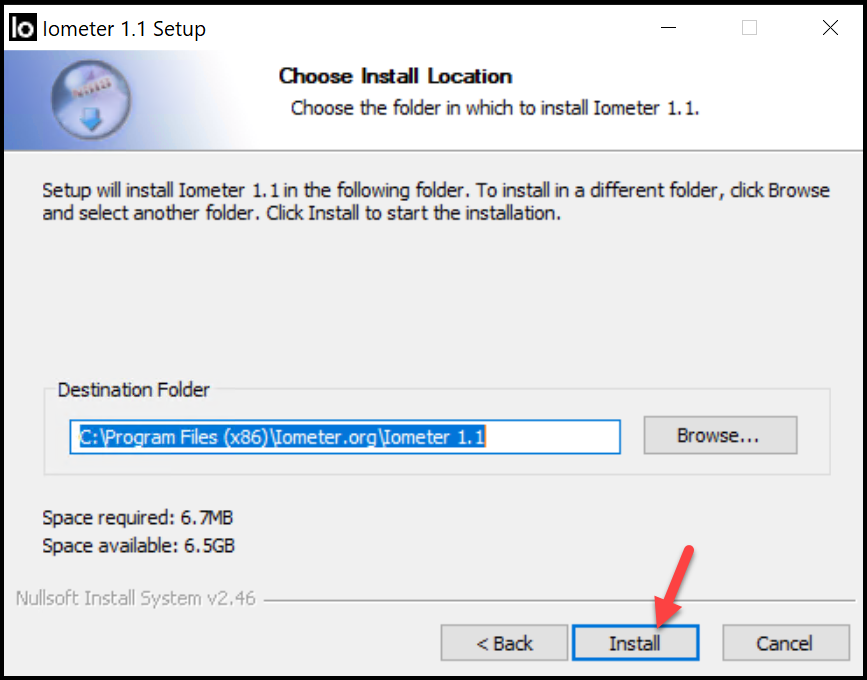
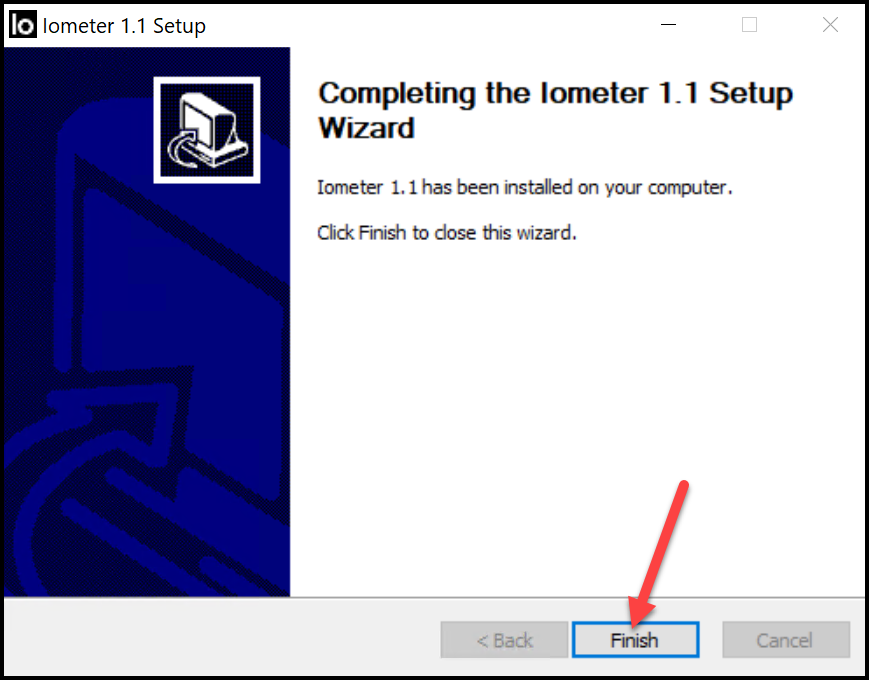
We can follow the steps below to install the IOmeter on Windows:
Executing the IOmeter
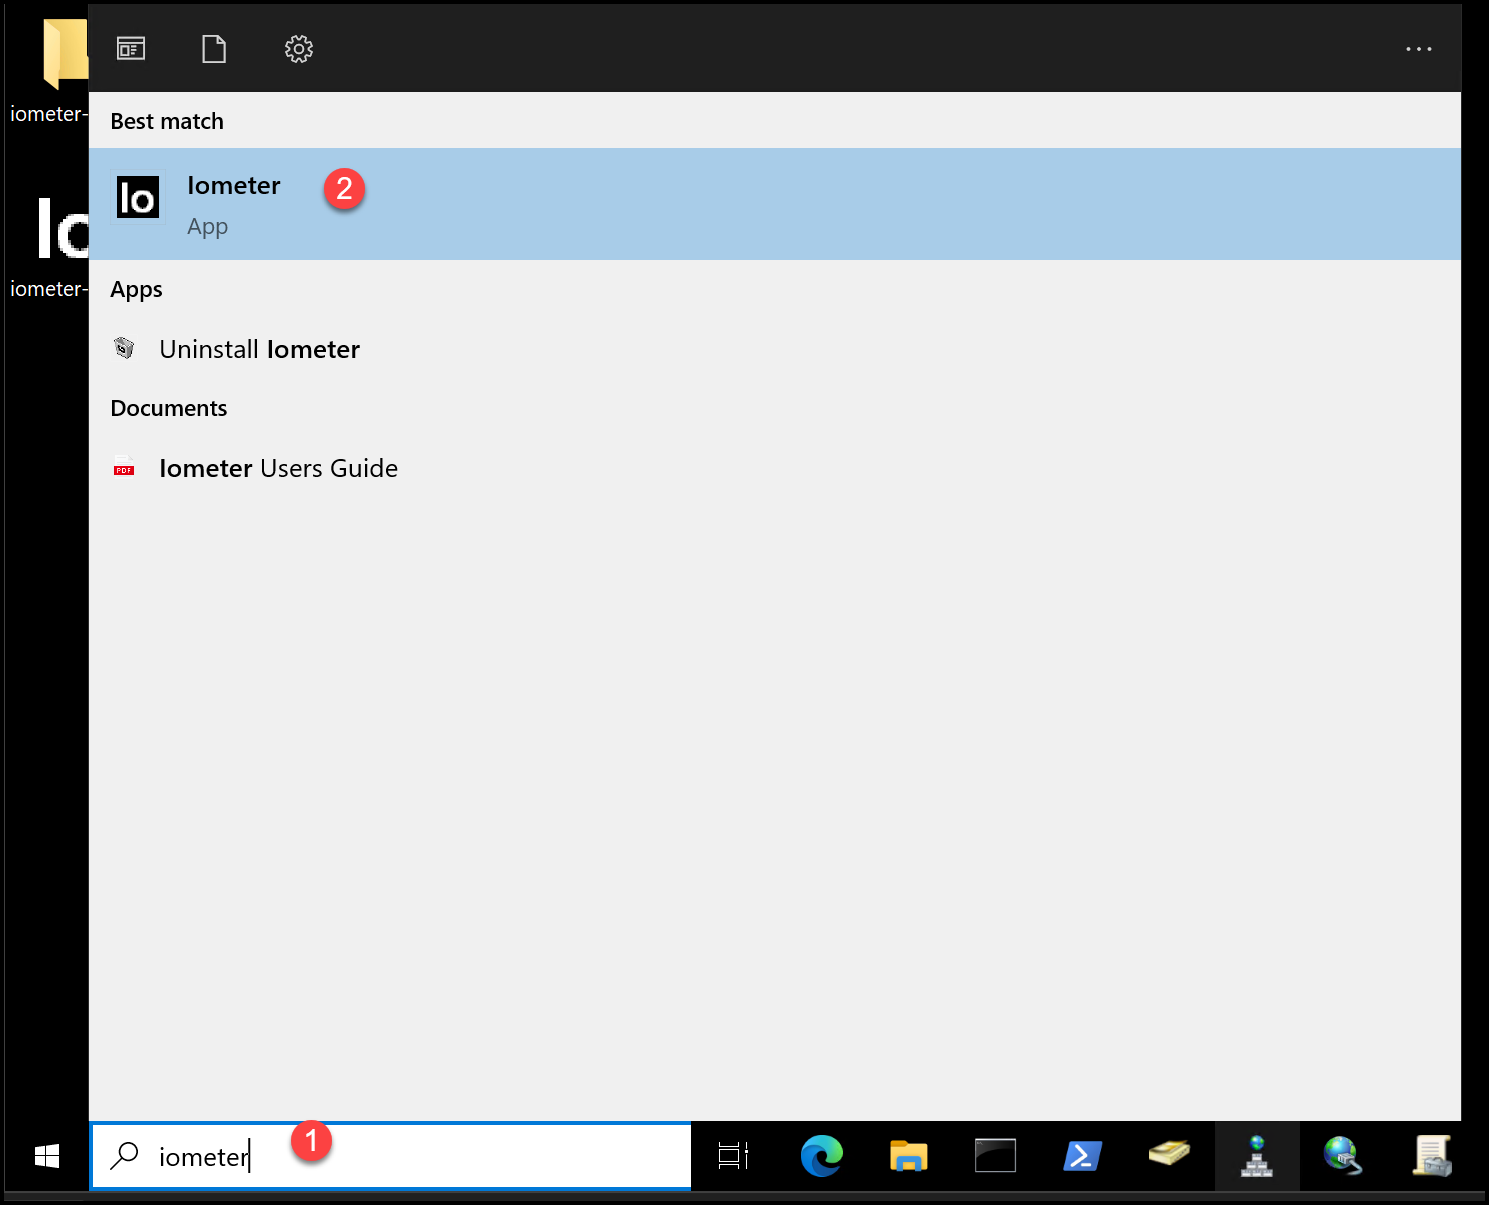
After installing the IOmeter, search for it and execute it:
When we click on the IOmeter software to run it, the IOmeter and the Dynamo will be started. The Dynamo will be opened on a command-line Windows, and the IOmeter will be opened on its own Window:
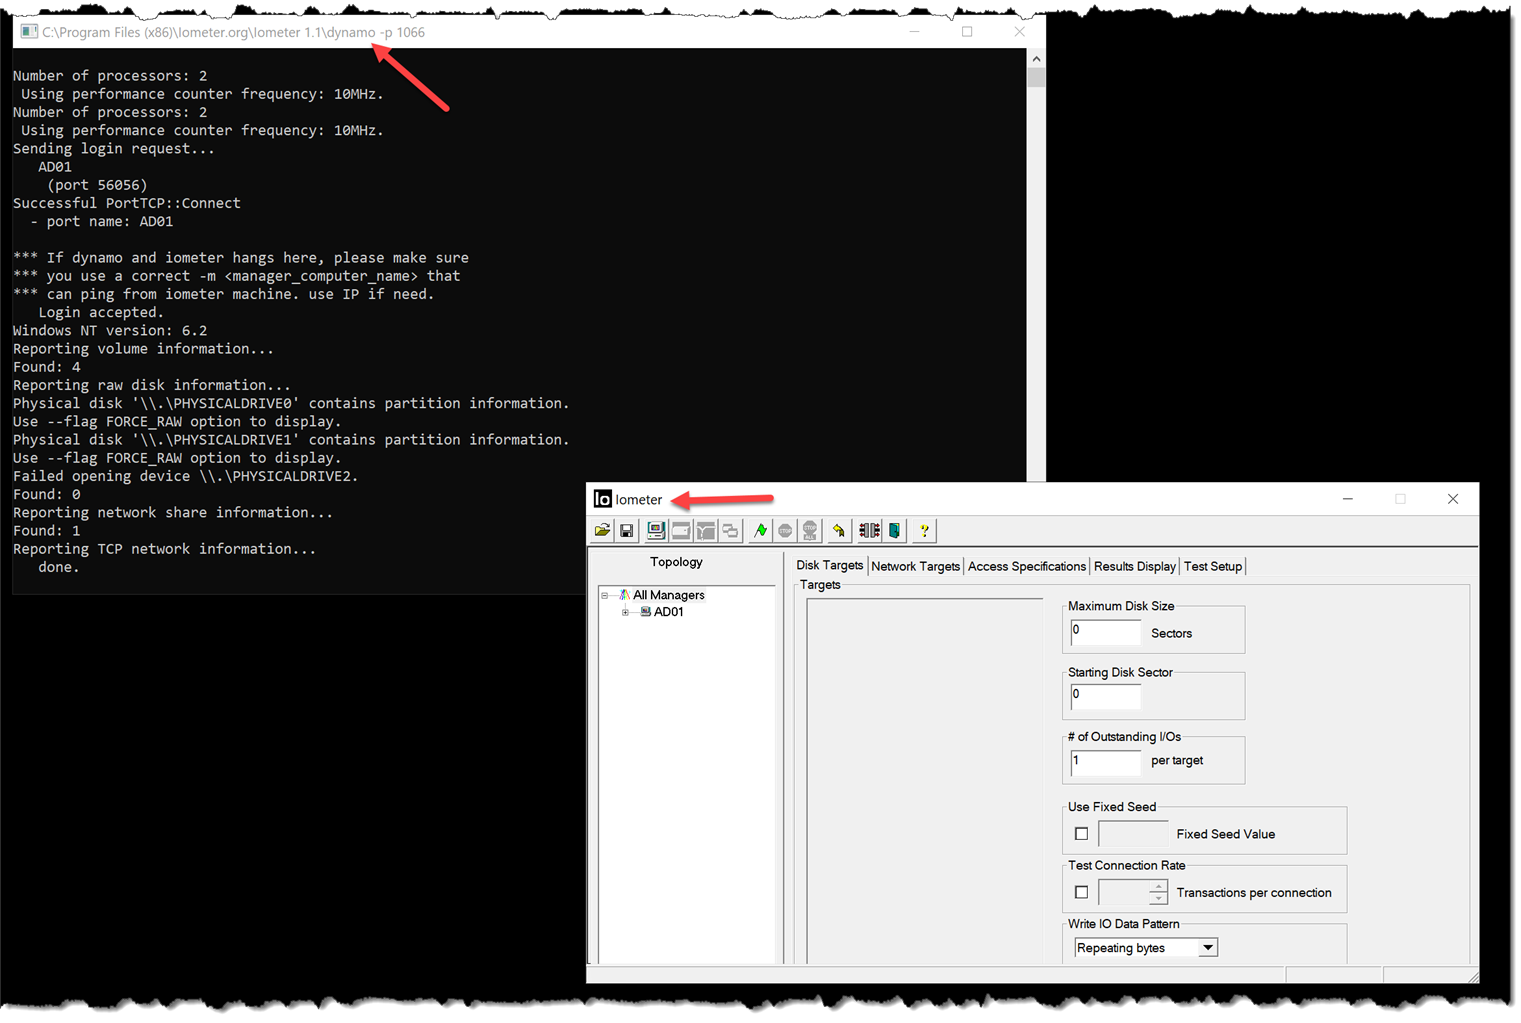
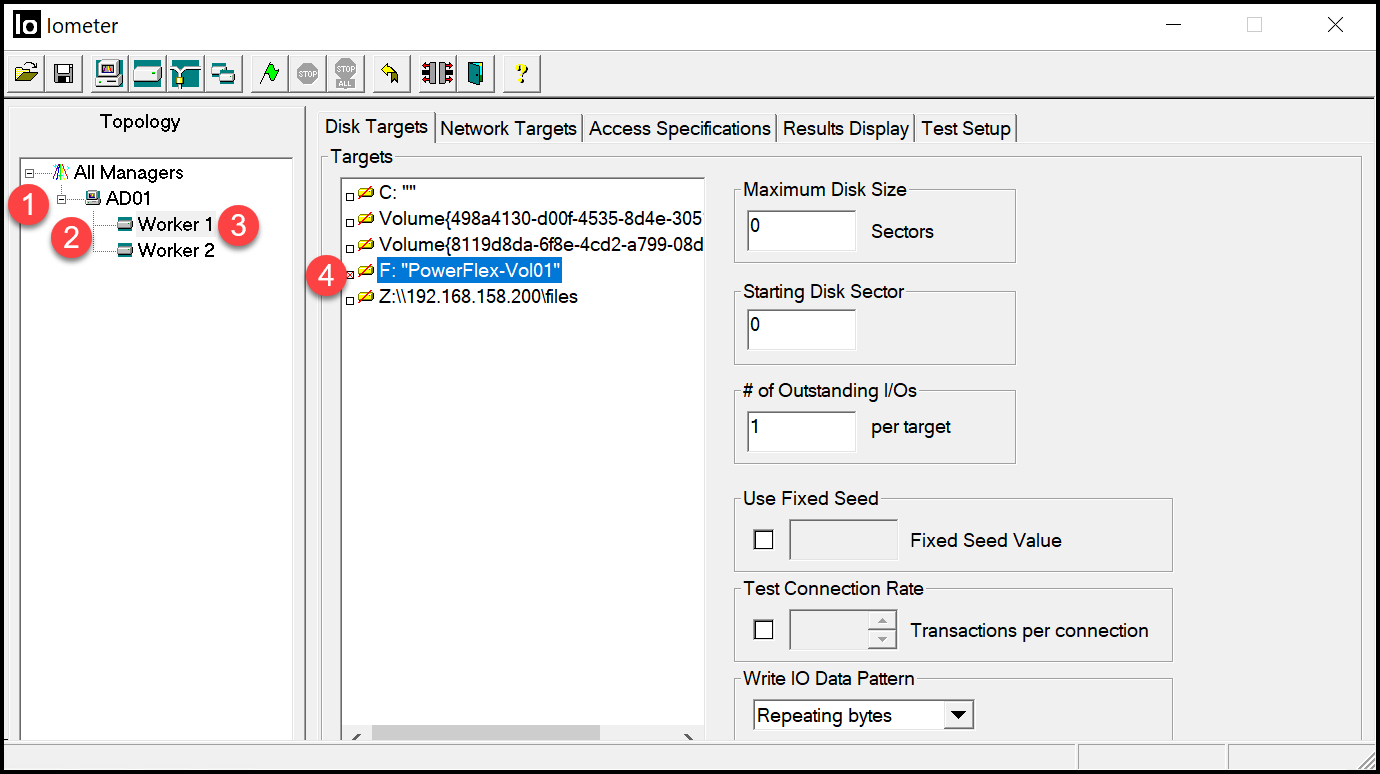
At the IOmeter screen, expand “All Managers.” We can see the hostname of the local machine. Expand it as well.
Select “Worker 1”. Under “Disk Targets,” select the disk you want to measure the performance on. In this case, for instance, the disk is “F: PowerFlex-Vol01”:
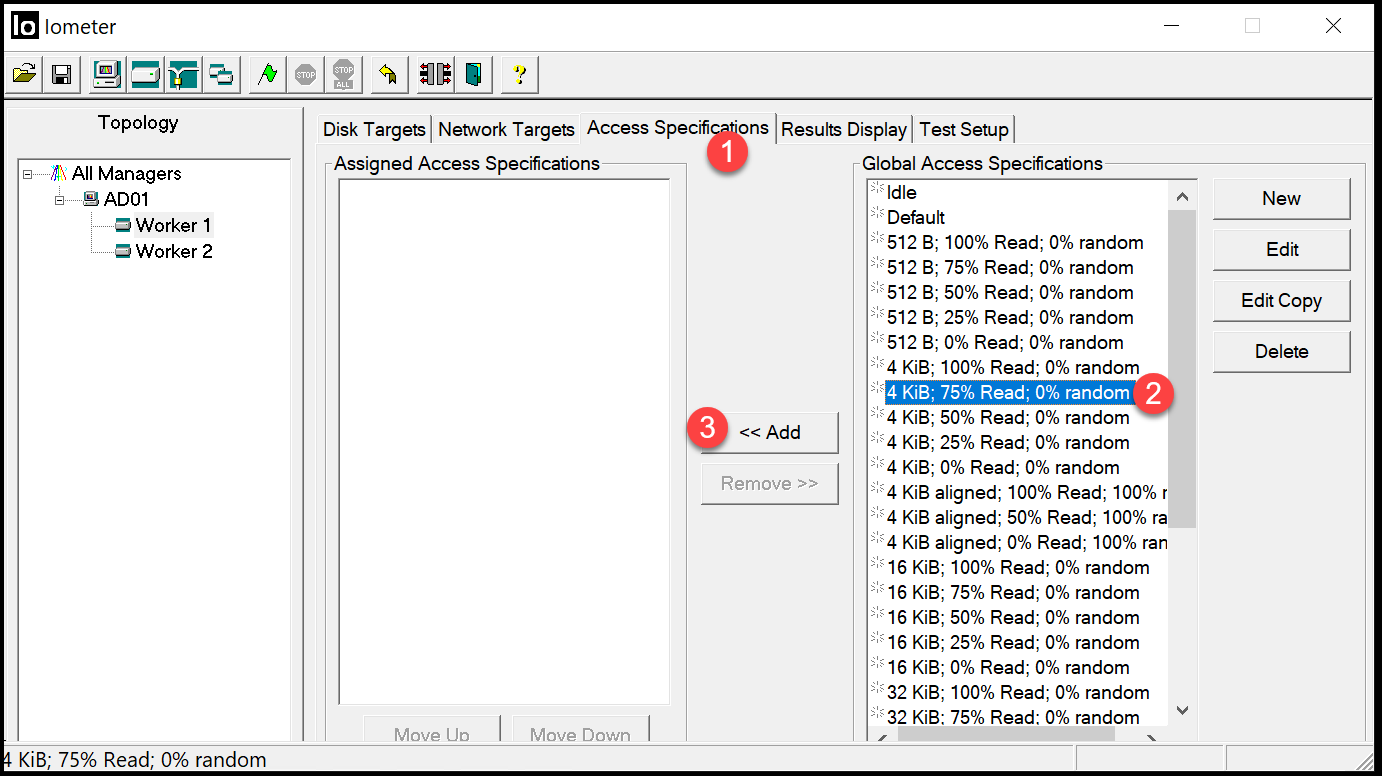
After that, go to the “Access Specifications” tab. In this tab, we will select the access details, such as block size, read access percentage, write access percentage, and whether it will be used for random access.
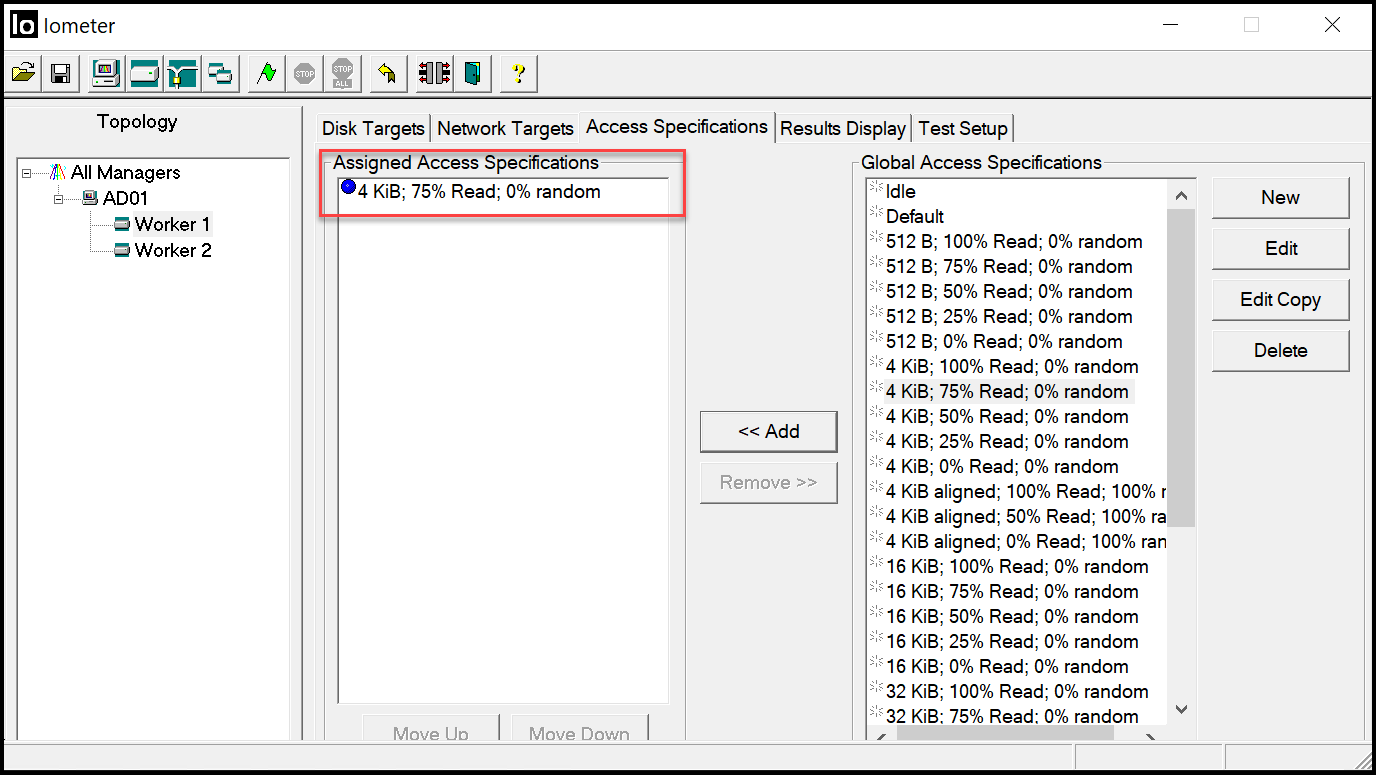
We will select “4 KiB; 75% read; 0% random” for our measure test:
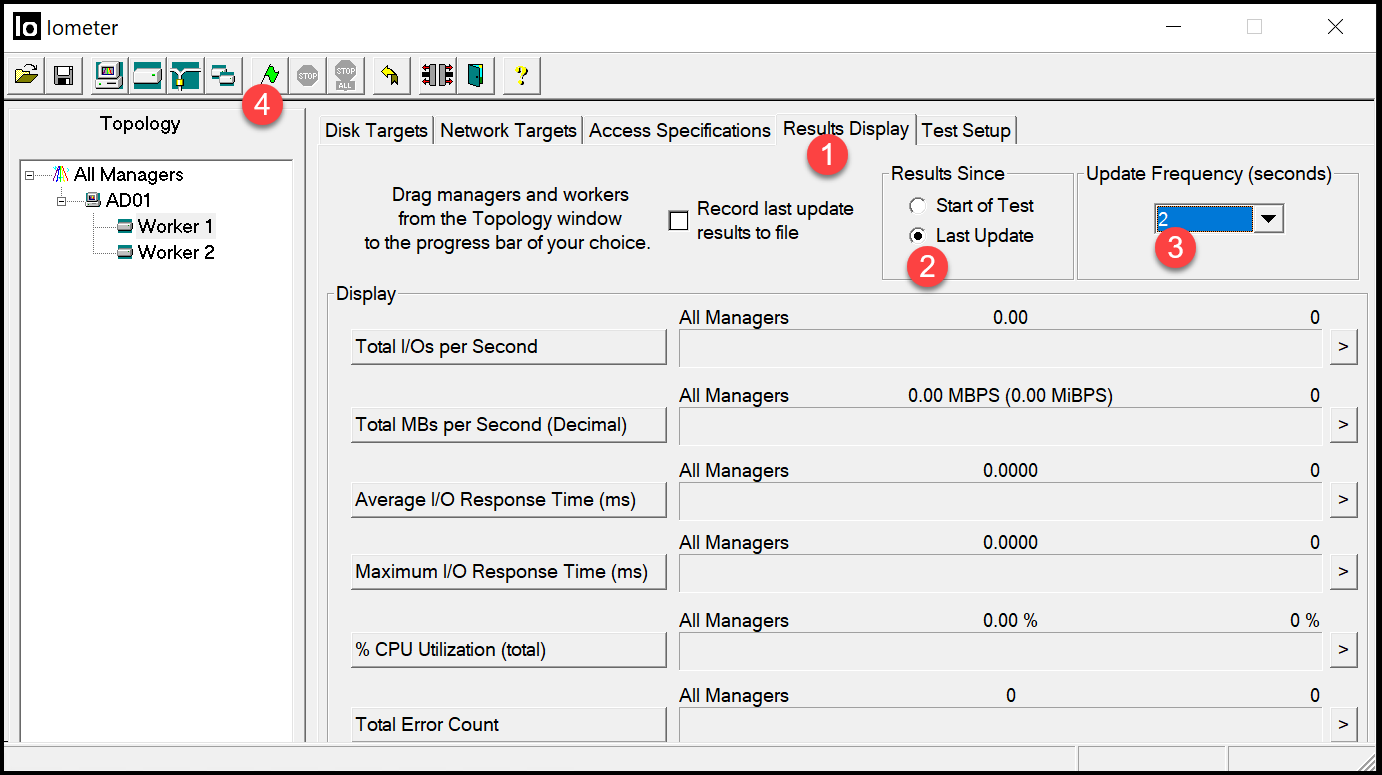
Move on to “Result Display” and adjust it as we can see below.
To start the test, click on the “Green Flag”:

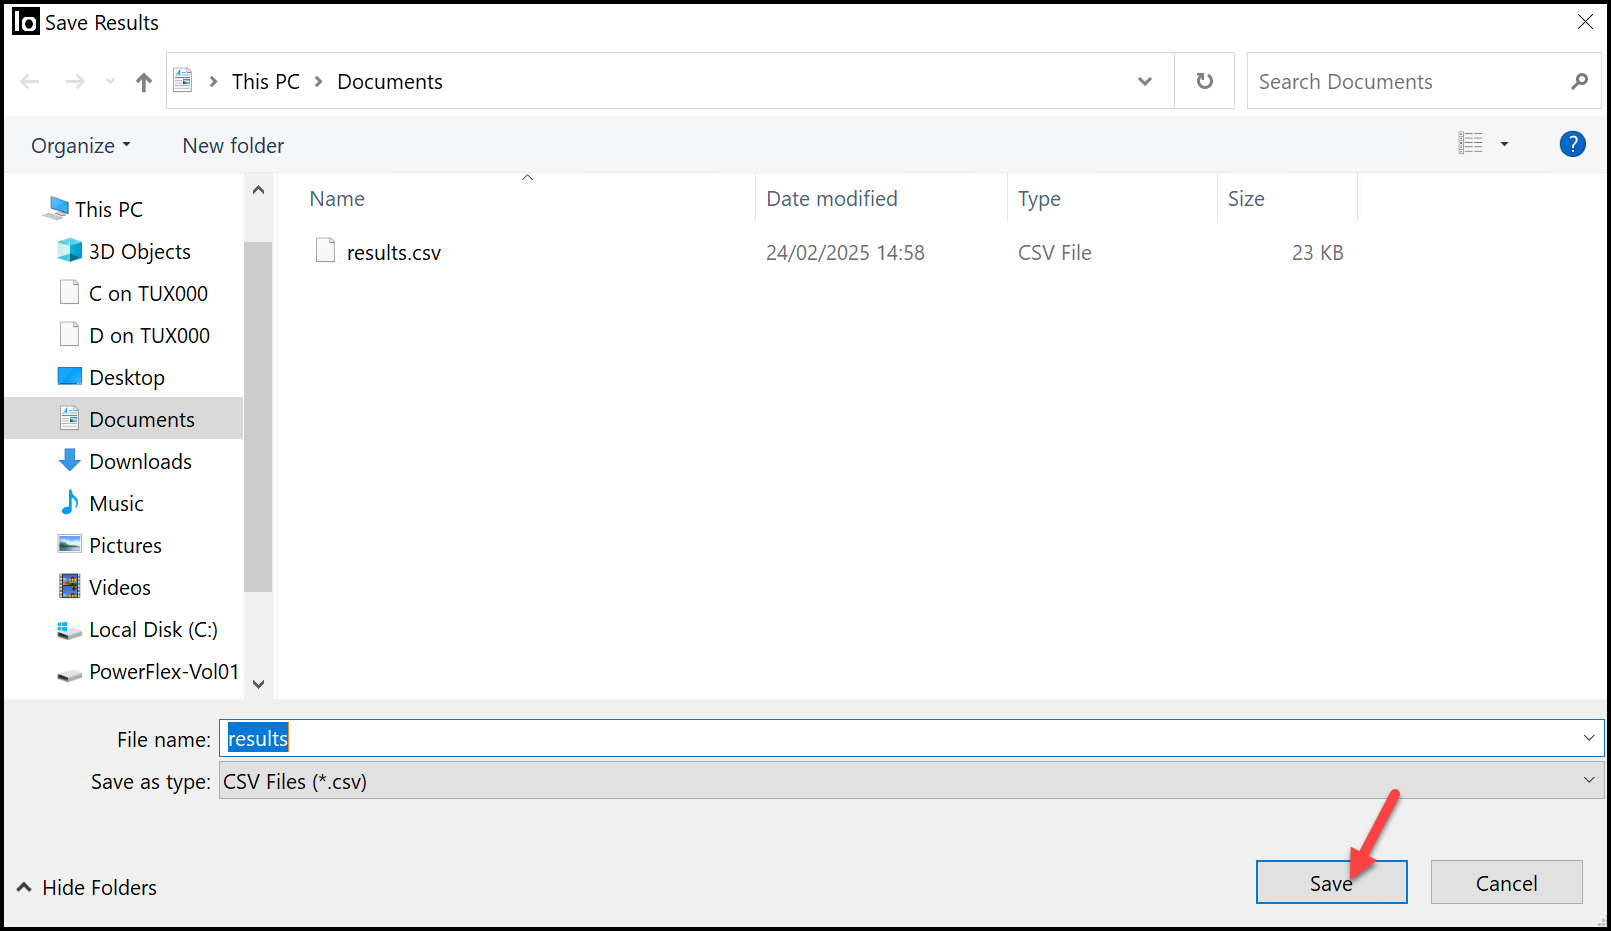
After starting the test, you will be asked to save a “results.csv” file by default. Select the best place to do it or accept the default suggestion:
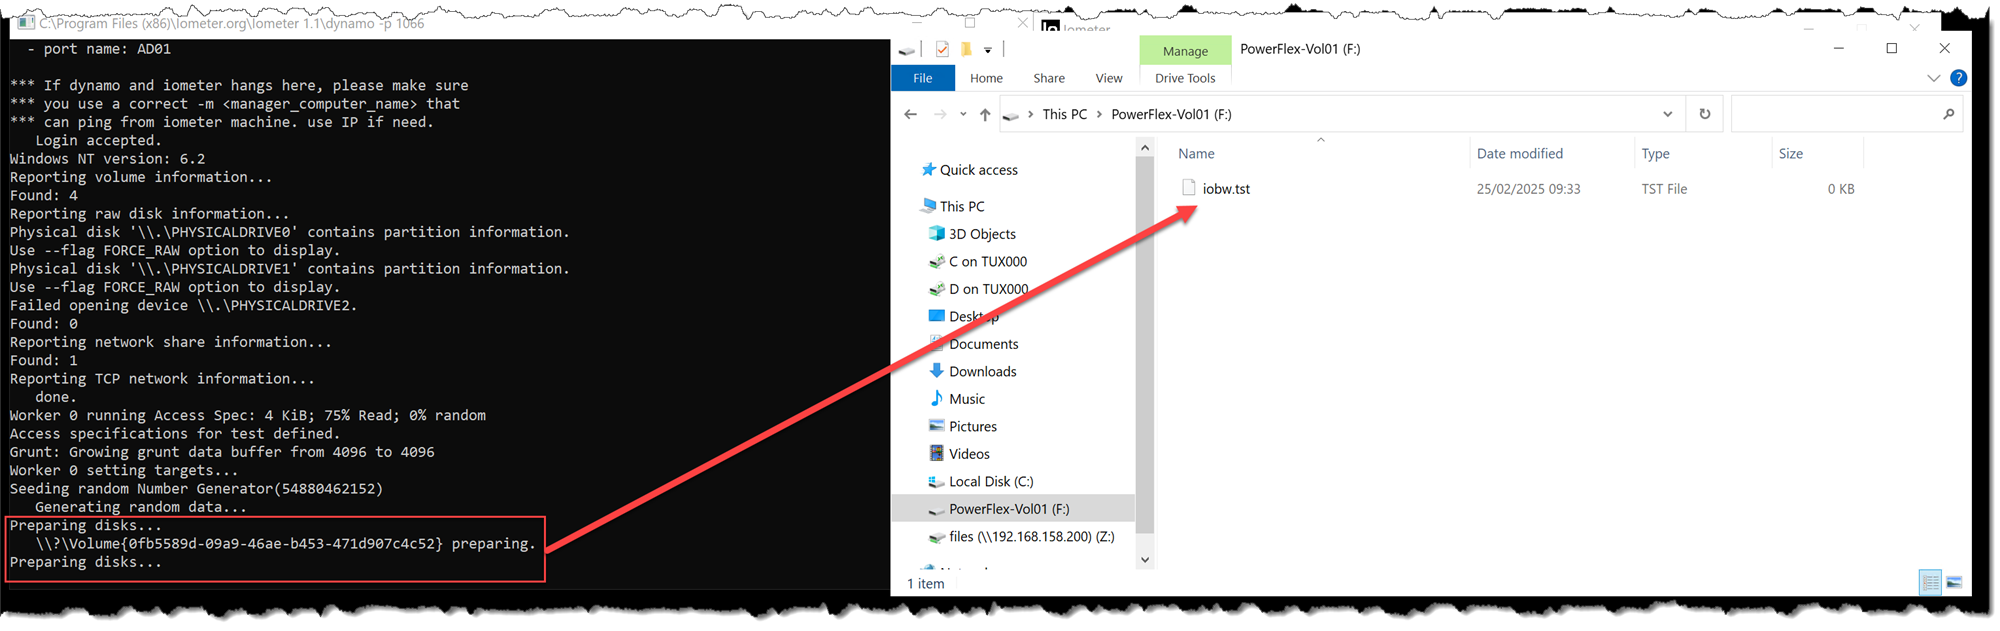
Look at the Dynamo console. The Dynamo will prepare the disk and will create an “iobw.tst” file inside the disk to be tested:
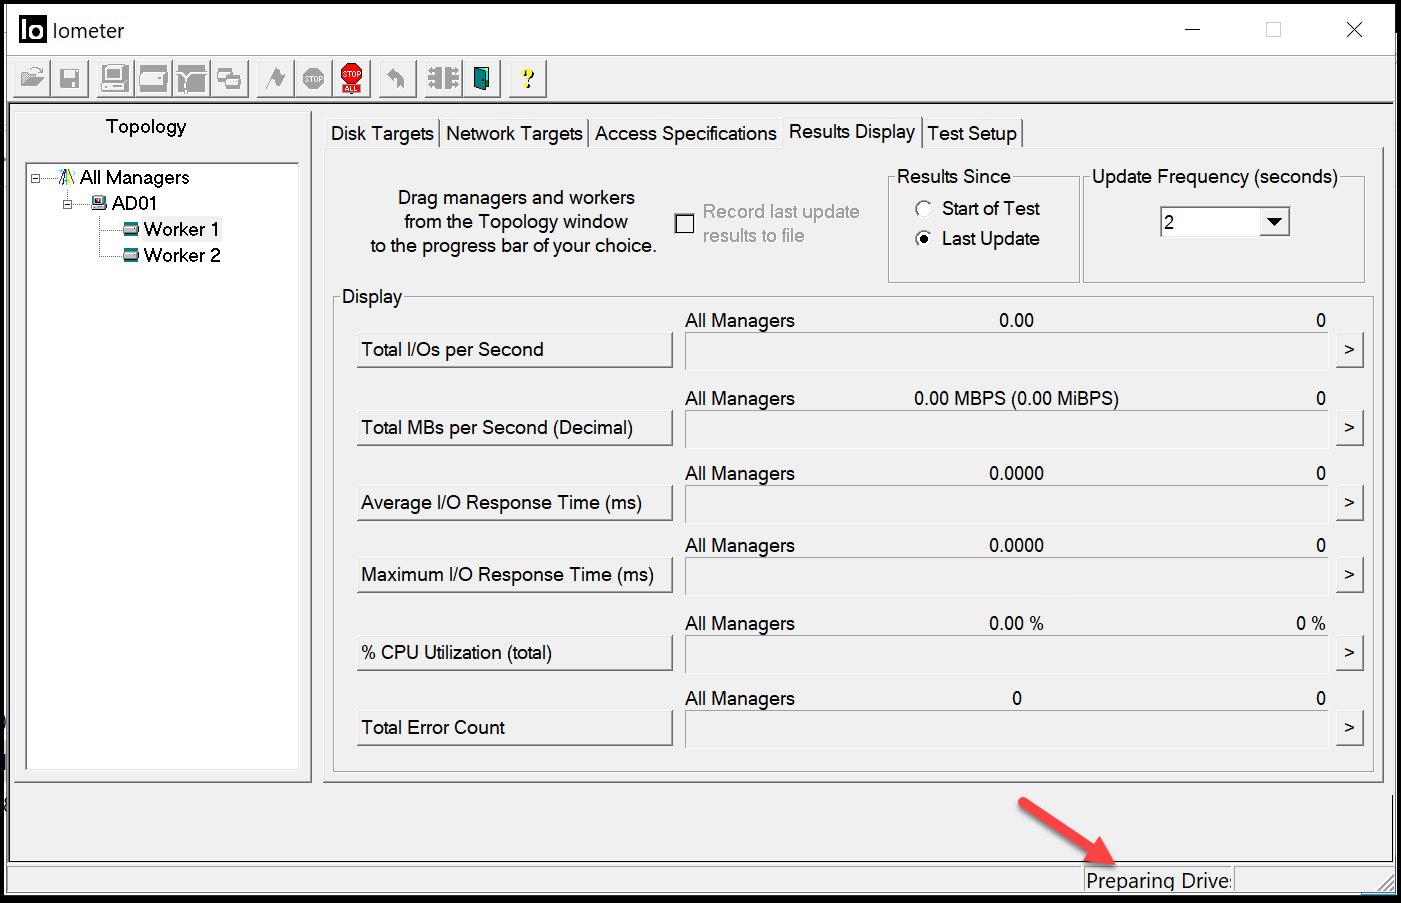
We cannot see any output at the “Results Display” tab during the drive preparation step. We need to wait for the Dynamo to prepare the disk – only after it the performance test will be started:
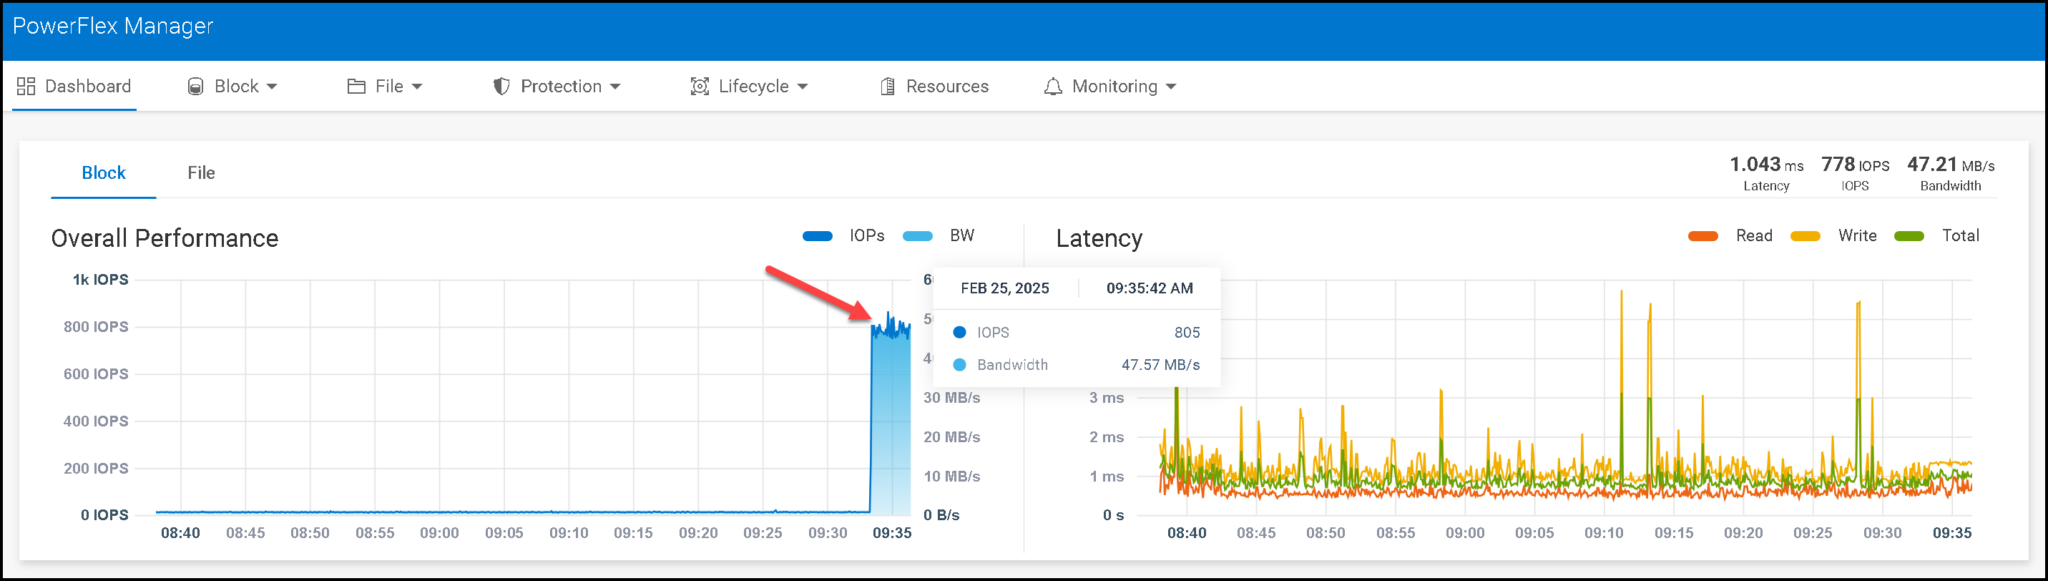
In parallel, we can go to the PowerFlex Manager dashboard. We can see that the IOPS and Bandwidth increased when we started the performance test:
After finishing the drive/disk preparation step, the Dynamo will start the performance I/O test:
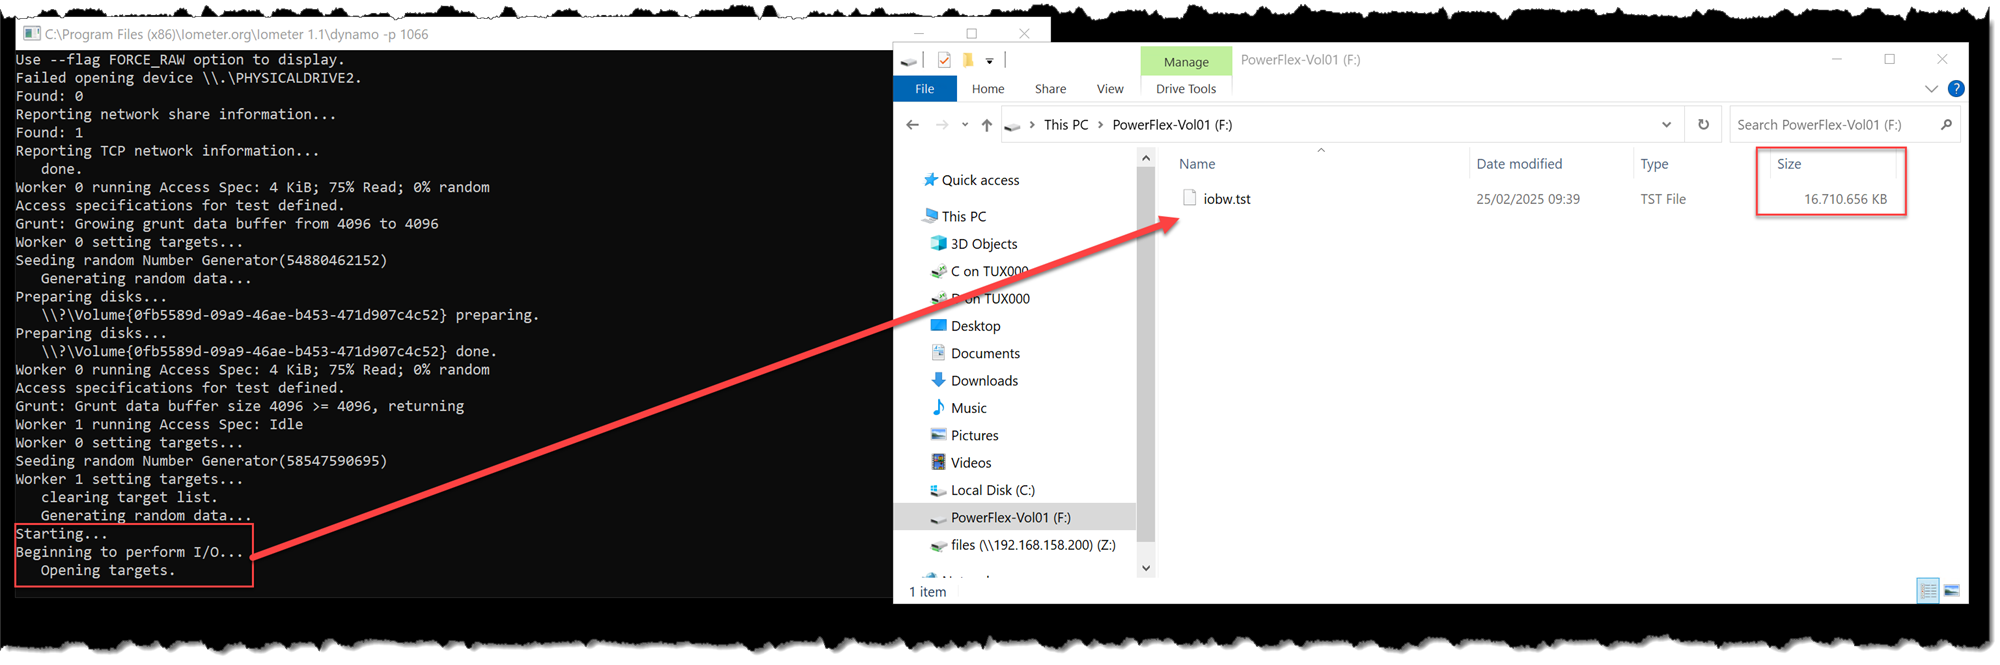
Note: Our PowerFlex volume has 16 GB. So, the Dynamo creates a file with the maximum volume size!
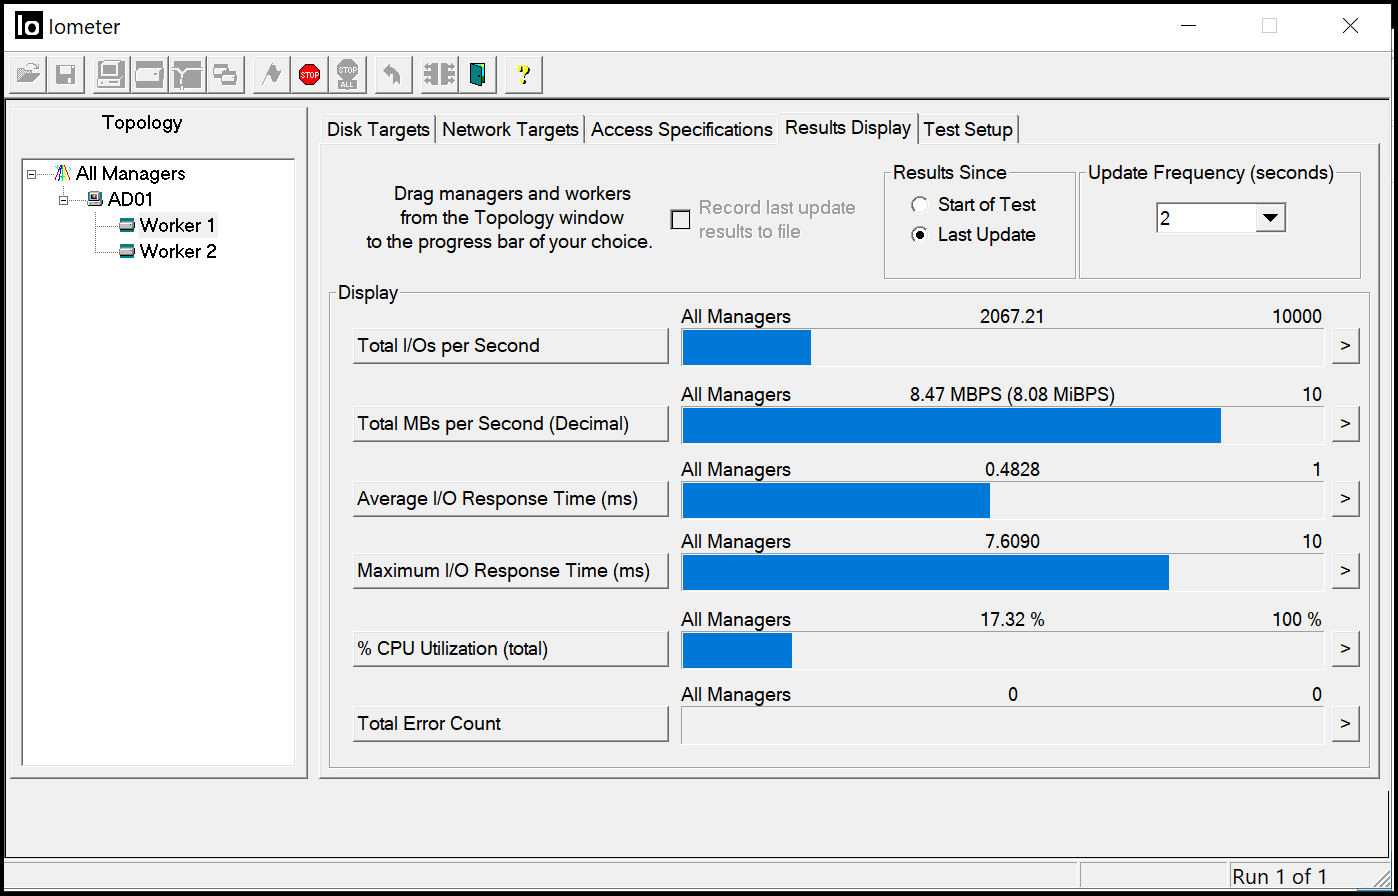
We can now see the test results on the Dynamo screen, updated every 2 seconds:
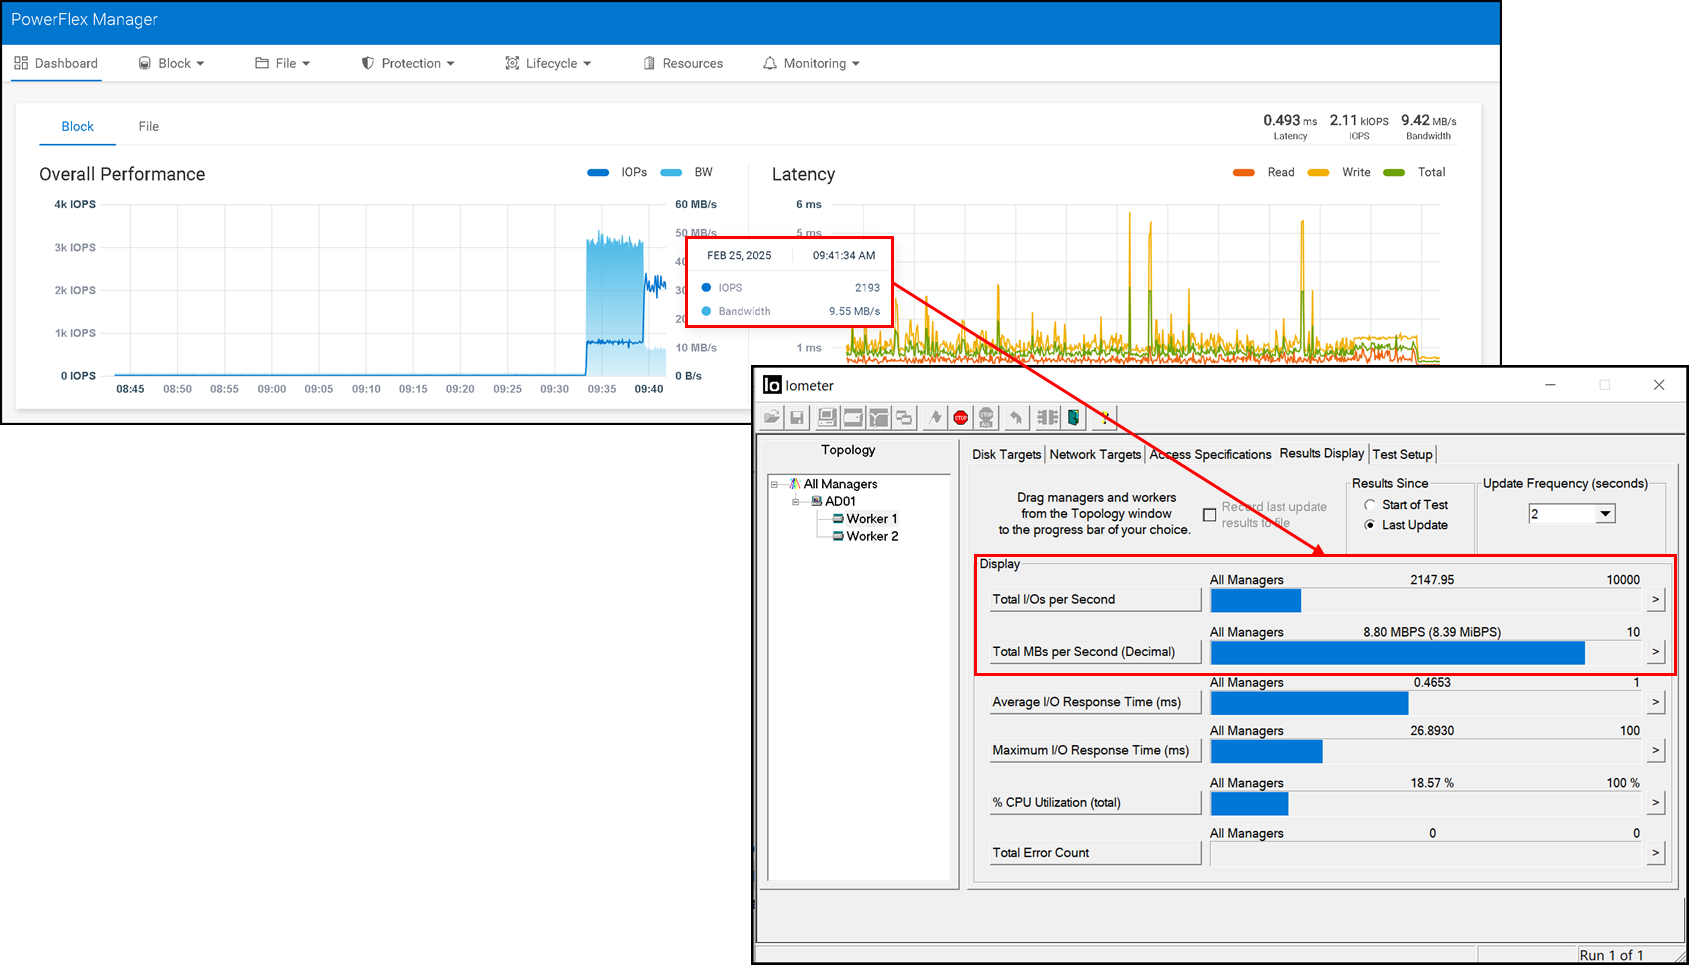
If we look at both screens (PowerFlex Manager and IOmeter), the IOPS and Bandwidth are very similar:
How can I Interpret the IOmeter Results?
Looking at the IOmeter Results Display tab, we can see that many metrics are being measured under “Display.”.
We can see the total IOPS, the bandwidth, the average and maximum I/O response time (latency), the percentage of CPU utilization, and an error count:
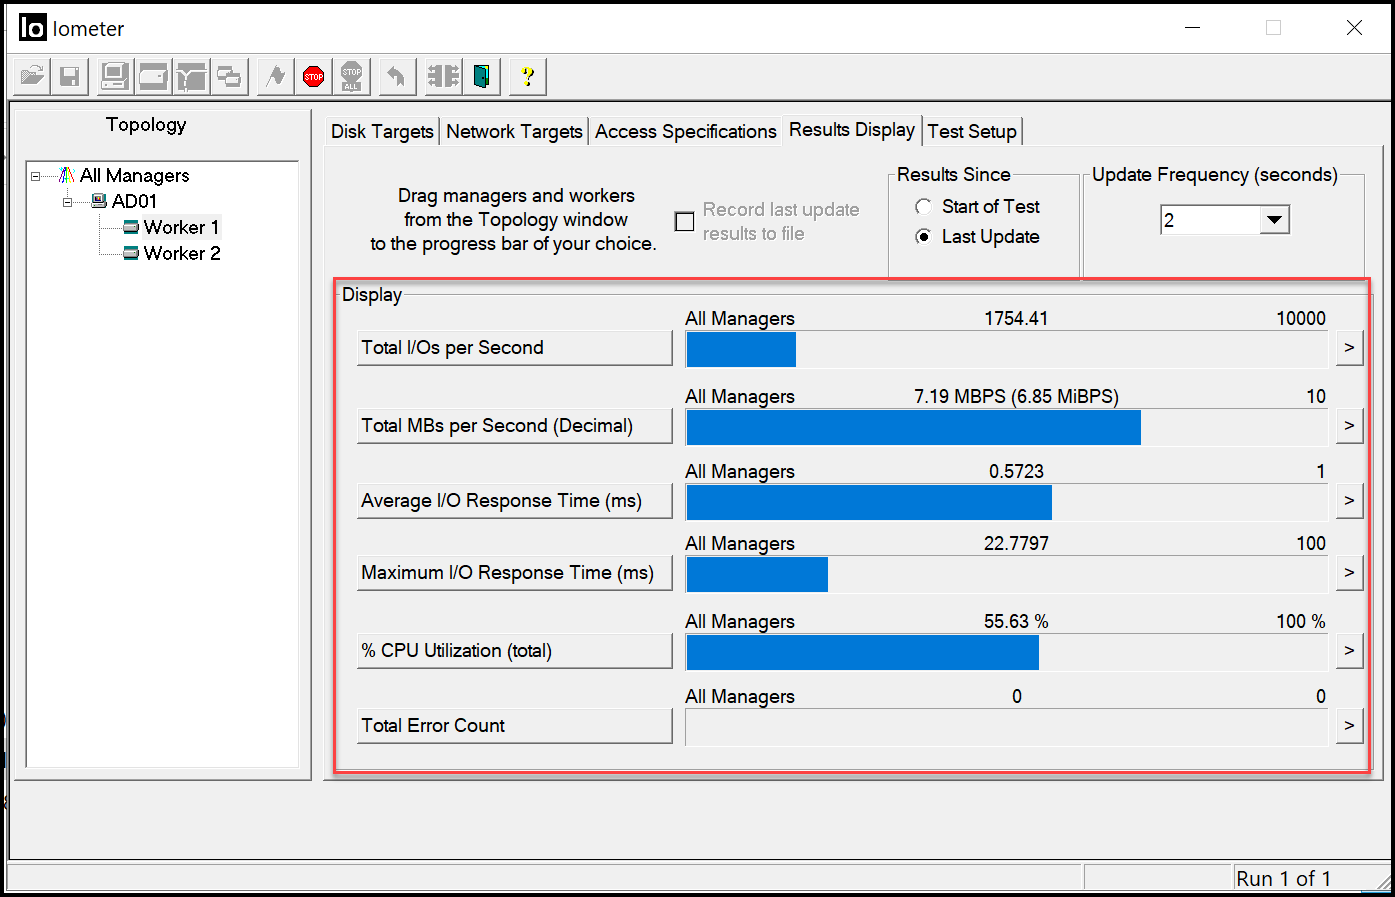
Important: We must remember that these results are based on the access specification we chose before (“4 KiB; 75% read; 0% random”). If you change it, the results will probably differ.
These results allow us to check whether the storage or backend system performs as expected. If not, we can analyze the path between the source/client and the storage system to determine the root cause for the poor performance (check the storage system resources consumption, network resources, and network interface errors, and if possible, do the same test for a different client system, etc.).
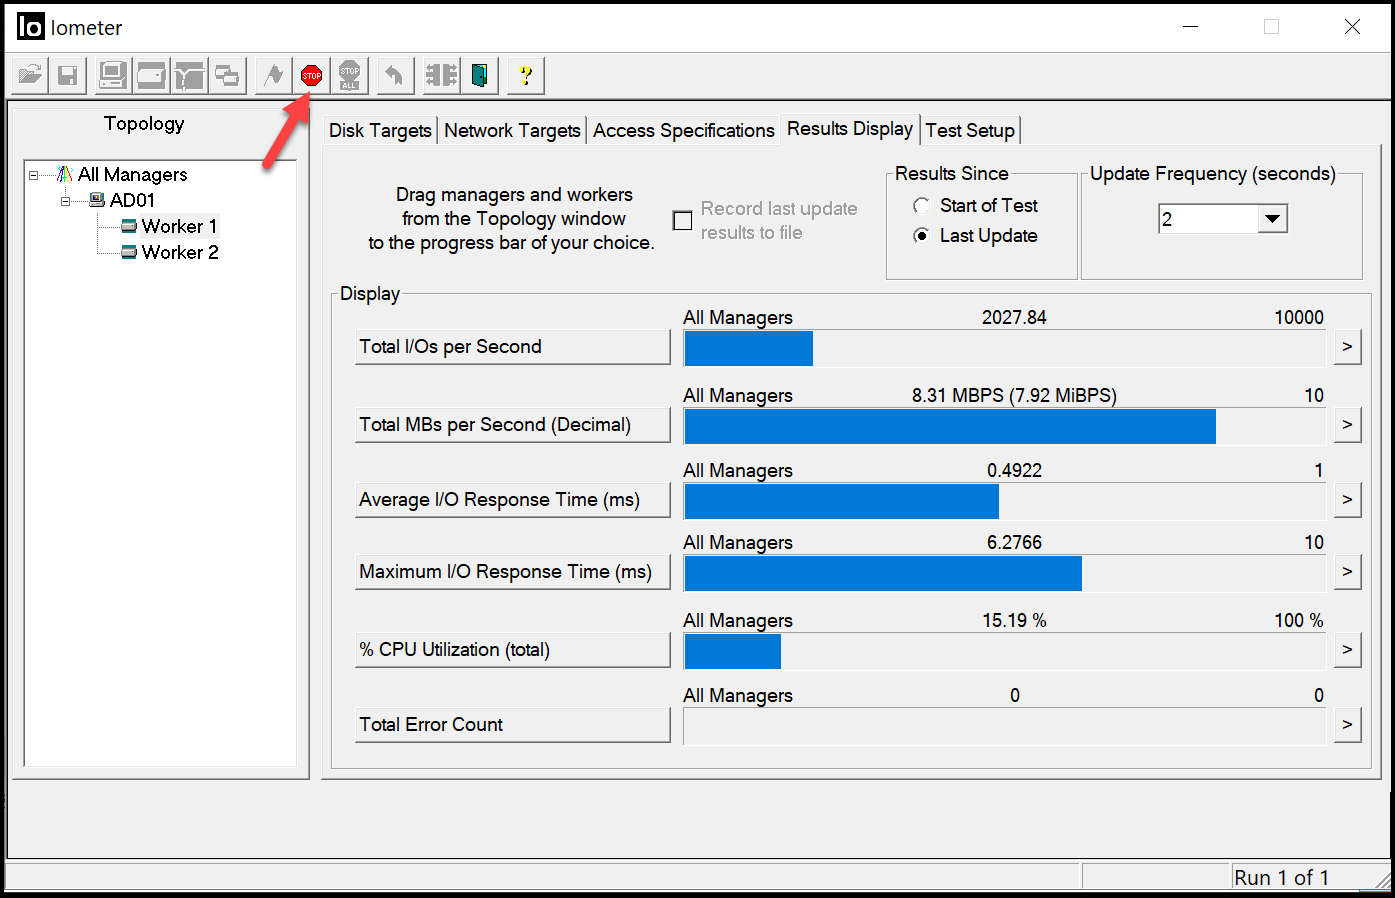
To stop the IOmeter test, click on the “Stop” icon:

To Wrapping This Up
IOmeter is a powerful and versatile tool for measuring and analyzing storage performance across various environments. Simulating different workload patterns helps administrators and engineers evaluate disk performance, identify bottlenecks, and optimize storage configurations for specific applications.
Its ability to generate customizable read/write workloads and test latency, throughput, and IOPS makes it invaluable for benchmarking storage systems, whether in virtualized, cloud, or traditional infrastructures. Using IOmeter ensures informed decision-making when designing or troubleshooting storage solutions, ultimately improving efficiency and reliability in IT environments.
